Comparison With Previous Studies
This section compares the results of this study with the results from other major studies of the economic costs of drug and alcohol abuse. Direct comparisons are made with Rice et al. (1990) and more general comparisons with Rufener et al. (1977), Berry et al. (1977), Cruze et al. (1981), and Harwood et al. (1984). After adjustment for inflation and population growth, the estimates from this study are of comparable magnitudes to those from the prior major studies on the economic effects of drug and alcohol abuse. Differences are understandable and explainable. Moreover, the total estimates are relatively consistent with each other in their magnitudes.
When considered at the finest level of detail, there have been literally hundreds of differences in data and methodology from study to study - and that is true in comparing this study with Rice et al. (1990). Still, it is fair to say that relatively consistent methodological approaches - using the human capital approach - have been applied to most of these studies. This is true in terms of the nature of effects that have been included in the estimates and how values have been estimated. Much of this consistency has to do with the fact that the methodology for producing cost-of-illness estimates has been developing for more than 40 years, with the landmark studies of Dorothy Rice in the 1960's setting forth general methodological principles and approaches that have been used in virtually all cost-of-illness studies since that time.
Differences in estimates over the years reflect several types of major changes. First, changes have occurred in the nature and magnitude of drug and alcohol problems, and there have been such significant changes over the time studied. Second, the data sets available have steadily changed, generally improving. Third, science has continued to develop knowledge about drug and alcohol problems, including health effects of alcohol and drug abuse and understanding of crime and other behavioral effects of alcohol and psychoactive drugs. Finally, valid differences of opinion exist over analytic methods and approaches, as well as interpretation of findings. The disciplines have not reached consensus about the extent of tangible or economic effects of drugs and alcohol on society, although this study - as those before it - is based on an attempt to portray plausible values about such effects.
Five Major Studies on Alcohol and Drug Costs
Figure 7.1 and table 7.4 compare these results with the prior estimates, making adjustments for inflation and population growth over the 17 years that these estimates cover. The current estimate for alcohol of $148 billion is almost exactly equal to the adjusted average of the four prior major studies ($144 billion), although it is 42 percent greater than that found by Rice et al. (1990). The drug abuse estimate of $97.7 billion is 50 percent greater than that of Rice et al. (1990). From the five major drug studies, there has been a clear trend of increasing cost estimates for drug abuse, representing increasingly large effects across the last 20 years.
Generally similar methodologies have been used to estimate the costs of alcohol abuse in each of the five studies. Although each successive study has incorporated the newest data and findings about the nature, extent, and impact of alcohol problems, generally these have not fundamentally changed the estimates. The estimate by Rice et al. (1990) yielded significantly lower estimates for health expenditures and reduced productivity than the prior studies. The present study has given intensive attention to those topics and documents the nature of the differences and the rationale and data that support the findings in this study (see in particular section 4.2 and section 5.3).
The current study has a comparable proportion of alcohol costs attributable to lost/reduced productivity in the workplace relative to the studies being discussed here - about 45 percent. The Rice et al. (1990) study had 39 percent of costs in this category, with a range of rates for Berry et al. (1977) (36 percent), Cruze et al. (1981) (48 percent), and Harwood et al. (1984) (57 percent). Using a new survey with a modified set of criteria for diagnosis (the NIAAA implementation of DSM-IV criteria), this study has higher estimates of prevalence (about twice as high as the ECA rates) but materially lower rates of impairment than previous studies using different surveys.
It will be important in the future to explore to what extent alternative diagnostic criteria applied to National Longitudinal Alcohol Epidemiological Survey (NLAES) data would yield different prevalence values (higher or lower) associated with different rates of impairment (higher or lower). For example, this study did find a particular subsample of persons with alcohol dependence (specifically, males who began drinking by age 15) with greater negative effects than for others. This analysis has primarily worked with the DSM-IV criteria applied to NLAES. It is clear that the nature and specifics of diagnostic criteria have a major impact on the findings.
The five major drug abuse estimates demonstrate a clear upward trend since 1975 that is generally attributable to increasingly severe effects of drugs. Although some notable methodological differences exist between the first study (Rufener et al. 1977) and all of the subsequent studies, there is evidence that much of the increase over the 17 years is due to the cocaine and HIV epidemics and to dramatic increases in drug-related incarceration. For example, State and Federal prisons in 1992 incarcerated about 8 times as many persons on drug offenses as in 1977 (213,000 versus 28,000) and about 3 times as many persons on crimes attributed to drugs, such as burglary (100,000 versus 32,000). The overall prison census almost tripled between 1977 and 1992 (U.S. Department of Justice 1994g).
The least stable cost component across the five drug studies has been the impact of drug abuse on employment and earnings. Actually, only one study (Harwood et al. 1984) incorporated a value for this component that constituted a significant proportion of total costs. The current study estimates this impact at about 60 percent more than was found by Rice et al. (1990) although it still constitutes only about 15 percent of total costs. Thus, it is not a significant source of difference between the findings of this study and those of the Rice et al. (1990) study and of studies before Harwood et al. (1984).
Comparison With Rice et al. (1990)
The estimates for costs of alcohol and drug abuse from this study are 42 and 50 percent greater, respectively, than the total values from Rice et al. (1990). Figure 7.2 and table 7.5 compare the total values as well as the respective major components of the costs. Estimates from Rice et al. (1990) have been adjusted to 1992 based on population growth (1 percent per year) plus inflation (medical consumer price index for health care expenditures, the all-items consumer price index for other costs, and the Bureau of Labor Statistics "employment compensation index" for all productivity effects). Note that under the sections of the report where findings are developed and discussed, there is a comparison with the methodology of Rice et al. (1990) if material differences exist between the two studies in this respect. The major similarities and differences for the principal cost categories are discussed below.
Drug and Alcohol Services
The primary difference is that hospital costs were a much larger proportion of alcohol costs in the estimates for 1985. More alcohol-related hospital episodes occurred in 1985 (about 500,000 versus 300,000 in 1992) and roughly the same number of drug-related episodes. However, the estimates for 1985 used a much higher cost per hospital day than has been employed in this report. The Rice et al. (1990) study used the average cost per hospital day for all diagnoses and all types of hospitals (in 1992, this average was more than $800 per day), while this study has used rates specific to treatment of drug and alcohol patients in hospital specialty treatment units ($300 to $350 per day in 1992). Both studies relied on data from specialty treatment providers to develop estimates of the volume of services of specialized providers.
Treatment of Medical Consequences
This is one of the two major areas of difference between this report and the Rice et al. (1990) study. Accordingly, this study has significantly higher cost estimates in these categories: $13.4 billion versus $4.9 billion (alcohol) and $5.5 billion versus $0.2 billion (drugs). The different approaches of the two studies have been analyzed and compared in section 4.2. The primary difference is that this study (as all of the prior studies on alcohol problems but none of the studies on drugs) has drawn on the epidemiological literature to identify particular health problems that are causally linked to alcohol and drug problems, respectively. Rice et al. (1990) generally did not use this literature or approach, except for estimates of fetal alcohol syndrome and in the analysis of premature mortality, where it was the primary approach. Rice et al. (1990) recognized the possibility that studies of attribution factors for co-occurring disorders based on mortality might yield different values than studies based on morbidity. Instead, the Rice et al. (1990) study analyzed the impact on hospital length of stay from having a nonprimary diagnosis of alcohol or drug abuse or mental illness. This study has adopted the contribution of calculating the increment in hospital length of stay, but it has also incorporated data that make attribution to drug and alcohol abuse of the proportion of hospital stays for selected disorders.
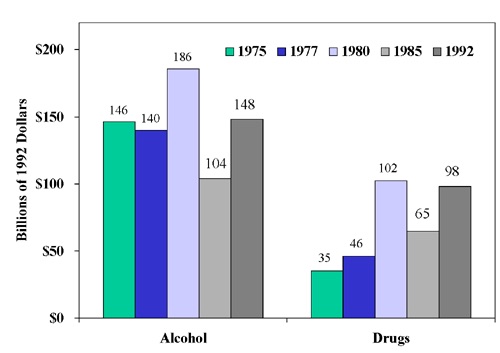 Figure 7.1 Comparison of Estimates From the Major Cost-of-Illness Studies for Alcohol and Drug Abuse, Adjusted for Inflation and Population Growth
Sources: 1975 alcohol: Berry et al. (1977); 1975 drugs: Rufener et al. (1977); 1977 drugs and alcohol: Cruze et al. (1981); 1980 drugs and alcohol: Harwood et al. (1984); 1985 drugs and alcohol: Rice et al. (1990); 1992 drugs and alcohol: analysis by The Lewin Group; price and population data: U.S. Bureau of the Census (1993).
Note: Bars in bar chart are arranged in order as cited in key.
Second, this study has reviewed the epidemiological literature about the relationship of drug abuse to several specific health problems (e.g., HIV infection, hepatitis, and tuberculosis) and developed estimates of attribution factors and costs due to drug abuse. This analysis was performed using the approach previously used to estimate the costs of fetal alcohol syndrome. Although Rice et al. (1990) did estimate the costs of HIV, other health problems had not been included in previous studies, primarily because of a lack of biomedical research. The dramatic increase in incidence of HIV from 1985 to 1992 is one underlying factor giving rise to the greater economic impact of drug abuse documented in this report.
Premature Mortality
This study has used the same methodology as that used by the previous study as well as by most of the major studies. The difference between the two sets of estimates for drugs is primarily due to the advance of the HIV epidemic since 1985. The major differences in the alcohol estimates are associated with this study's incorporation of the following:
- Use of a higher attribution factor for suicides (28 percent versus 13 percent, which added almost 5,000 deaths to the total);
- Use of a modestly lower attribution factor for motor vehicle deaths (42 percent versus 51 percent); and
- Addition of a small fraction of deaths associated with cerebrovascular disease (which added about 10,000 deaths).
Alcohol costs declined relative to the Rice et al. (1990) numbers, because the age distribution shifted from younger decedents to older decedents (e.g., traffic fatalities fell by 6,000 persons and cerebrovascular deaths increased by 10,000).
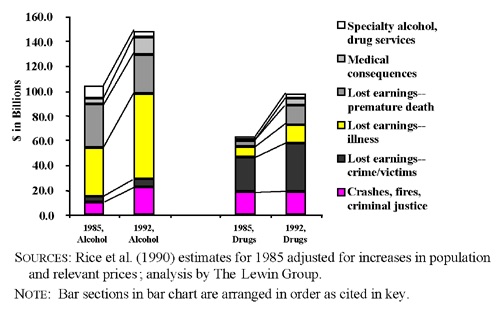 Figure 7.2 Changes in Costs of Alcohol and Drug Abuse Between Rice et al. (1990) and Present Study
Sources: Rice et al. (1990) estimates for 1985 adjusted for increases in population and relevant prices; analysis by The Lewin Group.
Morbidity-Impaired Productivity
Impacts of illness on productivity account for the major difference between the prior study and this study (discussed in greater detail in section 5.3). Higher estimates of alcohol-related costs have been developed primarily based on analysis of the NLAES. The NLAES offers certain specific advantages relative to other data bases, including being current, use of the new diagnostic criteria, and a relatively large sample size. Rice et al. (1990) used the Epidemiologic Catchment Area (ECA) study, which collected data in the early 1980's and used the prior DSM-III diagnostic criteria. Also, NLAES has better measures of labor market success than does the ECA study. Analysis of NLAES found higher prevalence of lifetime alcohol dependence (up to twice as high as in the ECA), although proportional effects of alcohol problems on earnings that are somewhat lower than Rice et al. (1990) and costs for drugs that are modestly higher.
Crashes and Criminal Justice Costs
Very similar methodologies have been used to estimate crime-related costs, although modest changes have been made to the attribution factors, primarily because of incorporation of more current data. Accordingly, the adjusted estimates for Rice et al. (1990) are very similar to those of the present study.
Motor vehicle crash costs have increased significantly, however. This is because much better data are now available about the causal involvement of alcohol in nonfatal crashes than for earlier studies. The causal rates used in this study for such crashes are about two to three times greater than values used in the prior alcohol studies, which have all used the same rates since Berry et al. (1977).
Lost Earnings From Crime
The change in these costs is predominantly because the corrections system incarcerated about 90 percent more inmates for alcohol- and drug-related charges in 1992 than in 1985. Thus, the number of persons incarcerated for alcohol- and drug-related offenses increased significantly. The increase was greatest for drug offenses. This study found that 220,000 inmates were incarcerated in 1992 in State and Federal prisons for drug-law violations, compared with 52,000 in 1985. This study and the prior study estimate the same full-time equivalent number of heroin addicts primarily engaged in "crime careers," but the number of nonheroin addicts is estimated to have doubled from 600,000 to 1.2 million.
Updated Estimates for 1995
The final element of this study is to develop more current estimates of costs, recognizing - as was done in Rice et al. (1990) and Harwood et al. (1984) - that it is both desirable and reasonable to make updated estimates based on the estimates in this report. The approach taken to making these updates is identical to the methodology employed in comparing this study's estimates with Rice et al. (1990) and with the prior major studies of the economic costs of alcohol and drug abuse.
Estimates of the five major cost components are updated for recent changes (total change over the 3-year interim) in population and in prices. Between 1992 and 1995, the population grew by 3.0 percent, the medical consumer price index (CPI) increased by 16.0 percent, the general CPI increased by 8.6 percent, and the hourly compensation index increased by 8.2 percent.
In developing the updated estimates, each of the 1992 values is increased by 3 percent for population and then further increased by the growth in the appropriate price index. The health care components (alcohol and drug abuse and medical consequences) are both increased by 16 percent (for the medical CPI). All of the productivity impacts (mortality, morbidity, and other related impacts) are increased by 8.2 percent. Other impacts are increased by 8.6 percent.
Total costs of alcohol and drug abuse are each estimated to increase 12.5 percent between 1992 and 1995 (see table 7.6). Alcohol abuse costs were an estimated $166.5 billion, and drug abuse costs were $109.8 billion in 1995.
Topics for Future Study
In many respects, this entire report can be read as an agenda for future research on the epidemiology, etiology, and economic effects of alcohol and drug abuse disorders. The objective has been to develop a relatively comprehensive set of cost estimates that address the major economic effects of alcohol and drug abuse. There are few cost components that cannot be improved with more and better data, which would support more probing analysis. Given this disclaimer, several topics continue to pose major challenges, as much because of their apparent magnitude as because of their complexity. These will be briefly identified here so that the interested reader may review the issue in the appropriate sections of the report.
Medical consequences of alcohol and drug disorders. The attribution factors used for alcohol abuse should be improved by undertaking a current review of the literature, which would differentiate causal studies based on mortality and morbidity (or at least health care utilization). The co-occurrence and causal link between mental disorders and alcohol and drug disorders is particularly important for further research. Another aspect of this research should examine the impact of alcohol and drug disorders on general utilization of health care services.
Health benefits of moderate alcohol consumption. The increasing evidence that moderate alcohol consumption seems to yield health benefits is cause for further study. The results should be particularly useful to those who are attempting to assess the costs and benefits of public policies with respect to alcoholic beverages.
"Willingness-to-pay" analyses. The typical estimates generated by willingness-to-pay studies for the value of life or quality of life are many times larger than other effects and costs for other threats to safety and life. Both the theory of willingness-to-pay and the application to alcohol and drug problems need to be examined to determine how this may or may not be applied to economic analysis. Cost-benefit studies performed for the U.S. Office of Management and Budget use the willingness-to-pay approach. While the safety field has applied the willingness-to-pay approach, the health field has made limited use of this technique.
The impact of alcohol and drug abuse on earnings. This constitutes the largest component of costs for alcohol abuse and a material cost for drug abuse. There have been very few data bases available to study this problem. Although this study has performed the first analyses to date on NLAES, there is a need for further work in order to determine how different diagnostic criteria correlate with employment and earnings. Longitudinal studies would be particularly interesting.
The impact of employee alcohol and drug problems on employers. While estimates of this type of impact have been attempted neither in this report nor in prior studies of the costs of alcohol and drug abuse, there is more than theoretical reason to believe that such costs are real and affect employers. These impacts would in theory reduce the productivity of workers, increasing costs and possibly increasing the price of goods and services to consumers and/or reducing the profits of employers. There is an opportunity to pursue this line of research, which could have important implications by helping employers to better understand the stake that they have in offering alcohol and drug prevention and treatment services for their workers.
The role of alcohol and drugs in crime. The data about crime, alcohol, and drugs are quite rudimentary, and the level of rigor and sophistication applied to analysis to date has generally been low. The challenges to address this topic are monumental, given the very high level of stigma likely to be associated with the study of illegal activities.
- Table 7.4: Original and Adjusted Estimates of the Cost of Alcohol and Drug Abuse, 1975-1992
-
Table 7.4: Original and Adjusted Estimates of the Cost of Alcohol and Drug Abuse, 1975-1992 (billions of dollars) Year of Estimate Alcohol Drugs Original Adjusted Original Adjusted 1975 42.8 146.0 10.3 35.0 1977 49.4 140.0 16.4 46.0 1980 89.5 186.0 49.4 102.0 1985 70.3 104.0 44.1 65.0 1992 148.0 148.0 97.7 97.7 Source: 1975 alcohol: Berry et al. (1977); 1975 drugs: Rufener et al. (1977); 1977 drugs and alcohol: Cruze et al. (1981); 1980 drugs and alcohol: Harwood et al. (1984); 1985 drugs and alcohol: Rice et al. (1990); 1992 drugs and alcohol: analysis by The Lewin Group.
Note: Original estimates are adjusted to 1992 values based on inflation and population change between the original year of the estimate and 1992. Inflation change is a weighted average employment compensation index (80 percent), medical consumer price index (10 percent), and general consumer price index (10 percent).
- Table 7.5: Changes in Inflation- and Population-Adjusted Costs of Alcohol and Drug Abuse Between Present Study and Rice et al.
-
Table 7.5: Changes in Inflation- and Population-Adjusted Costs of Alcohol and Drug Abuse Between Present Study and Rice et al. (1990) (millions of 1992 dollars) Alcohol Drugs 1985 1992 1985 1992 Specialty alcohol and drug services $10,172 $5,573 $3,735 $4,400 Medical consequences $4,935 $13,247 $226 $5,531 Lost earnings - premature death $34,573 $31,327 $4,740 $14,575 Lost earnings - illness $39,482 $69,209 $8,694 $15,682 Lost earnings - crime/victims $4,564 $6,461 $27,753 $39,164 Crashes, fires, criminal justice, etc. $10,307 $22,204 $18,537 $18,307 Total $104,033 $148,021 $63,685 $97,659 Sources: 1985 estimates from Rice et al. (1990); 1992 estimates by The Lewin Group.
Note: Components may not sum to totals because of rounding. Rice et al. (1990) estimates for 1985 adjusted for increases in population and relevant prices.
- Table 7.6: Updated Cost Estimates: 1992 Estimates and Inflation- and Population-Adjusted Costs of Alcohol and Drug Abuse for 1995
-
Table 7.6: Updated Cost Estimates: 1992 Estimates and Inflation- and Population-Adjusted Costs of Alcohol and Drug Abuse for 1995 (millions of current-year dollars) Alcohol Drugs 1992 1995 1992 1995 Specialty alcohol and drug services $5,573 $6,660 $4,400 $5,258 Medical consequences $13,247 $15,830 $5,531 $6,623 Lost earnings - premature death $31,327 $34,921 $14,575 $16,247 Lost earnings - illness $69,209 $77,150 $15,682 $17,481 Lost earnings - crime/victims $6,461 $7,231 $39,164 $43,829 Crashes, fires, criminal justice, etc. $22,204 $24,752 $18,307 $20,407 Total $148,021 $166,543 $97,659 $109,832 Source: Analysis by The Lewin Group.
Note: Components may not sum to totals because of rounding.