Synopsis
Alcohol and drug abuse cost society an estimated $86.1 billion from direct costs and losses in productivity related to crime, social welfare expenditures, motor vehicle crashes, and fire destruction. Drug abuse is estimated to have cost $57.5 billion of these non-health-related costs, and alcohol abuse is estimated to have cost another $28.7 billion (see table 6.1).
Principal among these costs are the costs of crime. In 1992, alcohol and drug abuse caused an estimated 25 to 30 percent of violent crimes and property crimes (depending on the specific type of crime). Direct costs of alcohol- and drug-related crimes, including police and private protection services, adjudication, corrections, and property destruction, were estimated at $24.3 billion. Another $45.6 billion was incurred as lost productivity among crime's victims, incarcerated offenders, and persons who engage in crime careers rather than the legitimate labor market. Nearly 600,000 person-years were served because of alcohol or drug abuse-related offenses (a loss of $23.5 billion in potential productivity) and another 600,000 persons withdrew from the legitimate labor market primarily to pursue income-generating crime and/or drug dealing (a loss of $19.2 billion in potential legitimate productivity). The productivity losses resulting from crime were discussed in chapter 5.
This study also estimates that alcohol and drug abuse caused 3 to 4 percent of social welfare cases (depending on the particular social program) in the United States in 1992. Social welfare programs include income maintenance and related cash assistance programs, as well as foster care. It is estimated that more than $1.0 billion was spent administering welfare benefits for cases caused by alcohol and drug abuse problems. An additional $10.4 billion in transfer payments was made as a result of alcohol and drug abuse problems, sometimes to the alcohol and drug abusers themselves and sometimes to their families. The value of transfer payments does not represent a "net loss" to society and accordingly is not counted in the total cost.
Alcohol abuse has been implicated in about 18 percent of all motor vehicle crashes and nearly 40 percent of fatal crashes in the United States. This study estimates that the direct costs (mainly property destruction) of alcohol-related motor vehicle crashes were more than $13.6 billion in 1992 (costs of injuries and deaths were counted in previous chapters). This study also estimates that costs of about $1.6 billion were incurred as a result of alcohol-related fire destruction and fire containment.
Crime and the Criminal Justice System
Synopsis
The extremely strong links between alcohol or drug abuse and crime have long been the issues of public policy concern. This controversial issue has stimulated theory and research about what these links mean, with steady progress, although there is certainly not yet a consensus. This study estimates that illicit drug and alcohol abuse were responsible for $69.9 billion in economic costs in 1992 - $57.1 billion for illicit drugs and $12.8 billion for alcohol abuse. These estimates are based on plausible estimates or assumptions of the causal relationships between illicit drugs and alcohol and various types of crime. The estimates of causal involvement attempt to find a midlevel between the extremes and, in so doing, to demonstrate the general magnitudes of the various types of impacts that alcohol and drug abuse-related crimes have on our Nation. The causal estimates used in this study are as follows:
- Drugs are responsible for about 25 to 30 percent of property crime and 4 to 5 percent of violent crime (the causal values are slightly different for the specific offenses within types).
- Alcohol is responsible for about 25 to 30 percent of violent crime and 3 to 4 percent of property crime (the causal values are slightly different for the specific offenses within classes).
- All "drug-defined" (e.g., dealing and possession) and "alcohol-defined" (e.g., driving under the influence and public drunkenness crimes) are so attributed.
Data (see Table 6.2) have been used to argue for much higher attribution rates. Alcohol and drugs are present in violent crimes and property crimes much more frequently than is reflected in the rates employed in this study. Conversely, there are also arguments for lower attribution rates. Some researchers have legitimate concerns that certain persons simply choose to engage in crime and to abuse alcohol and/or drugs, with no causal relationship between their crime and alcohol or drug abuse. This study - following the examples and methodologies of Cruze et al. (1981) and Rice et al. (1990) - uses causal estimates that straddle the extremes.
The estimates are directly comparable to the prior major studies in the types of costs that are included. This study includes the following:
- Cost of criminal justice system services;
- Losses by crime victims; and
- Opportunity costs of alcohol and drug abusers' foregone productivity in the legitimate economy because of either alcohol and drug abuse-related incarceration or engaging in "crime careers" (drug dealing and trafficking; income-generating predatory crime; and/or consensual crime, such as gambling and prostitution).
A current study (Miller et al. 1997b) is examining only the costs to victims, covering all of the elements of victim costs in these and prior alcohol and drug abuse cost studies. The study by Miller et al. (1997b) is using similar sources of data and estimation methods but is adding values reflecting "quality-of-life" impacts of crime using the willingness-to-pay methodology (discussed in chapters 3 and 5). Willingness-to-pay studies typically yield quality-of-life estimates that are an order of magnitude larger than the impacts valued using the human capital approach employed in this study.
This report reviews data from a broad range of data sources about drugs, alcohol, and crime, and it summarizes several current theories that attempt to explain the nature of the linkages between alcohol and psychoactive drugs and various types of crime. The data documenting the extent of the alcohol-crime and drug-crime linkages and theories about these linkages have advanced during the past 15 years. Still, no consensus has been attained, nor has the concern among some been dispelled that the alcohol and drug abuse-crime relationships may be entirely or largely spurious.
The rest of this section reviews data and trends on the nature, level, and effects of crime and alcohol or drug abuse and then directly addresses the data and theories about the relationship between alcohol or drug abuse and crime. This latter discussion is broken into reviews about alcohol and crime and drugs and crime, respectively. The concluding parts of this section develop and present estimates of values of the different types of economic effects that this study attributes to illicit drug and alcohol abuse. Estimation of crime-related lost productivity attributed to alcohol and drug abuse is described in chapter 5, section 5.6.
Trends in Crime and Alcohol and Drug Use
Crime
According to the National Crime Victimization Survey (U.S. Department of Justice 1993b), 33,649,000 criminal victimizations occurred in 1992 (based on a representative national sample). This figure suggests that one out of every six Americans ages 12 and older, was the victim of a crime. Of those criminal victimizations, 6,621,000, or almost 20 percent, were violent victimizations - yielding a violent victimization rate of 32.1 per 1,000 persons ages 12 and older. In contrast to the estimated number of victimizations, in 1992 there were 14,438,191 criminal offenses reported to the police (U.S. Department of Justice 1994b). This figure is lower than the figure reported by the National Criminal Victimization Survey because only a fraction of offenses experienced by victims and estimated from personal surveys are reported to the police. Because national news media reports exaggerate and sensationalize the extent of criminal activity in the United States, many Americans may perceive that the threat of crime has increased Yet, crime levels have remained stable or have declined modestly during the past 10 to 12 years, although this is more true for property crimes than for violent crimes (see figure 6.1). Of the more than 14 million offenses and arrests in 1993, larceny-theft and burglary were among the most often reported crimes. Table 6.3 disaggregates the number of known offenses, and table 6.4 disaggregates the number of known arrests.
As a consequence of criminal victimization, victims experience personal injury, economic loss, and/or psychological trauma. In 1991, of violent crime victims who were injured, 51 percent received some level of medical treatment, and 10 percent incurred medical expenses. In the cases in which the dollar figure was known, medical expenses exceeded $250 in almost 60 percent of the victimizations (U.S. Department of Justice 1993c). In the same year, 72 percent of all personal victimizations and 92 percent of all household crimes resulted in economic losses. In 1991, approximately $19 billion was lost because of personal and household crime (see table 6.5).
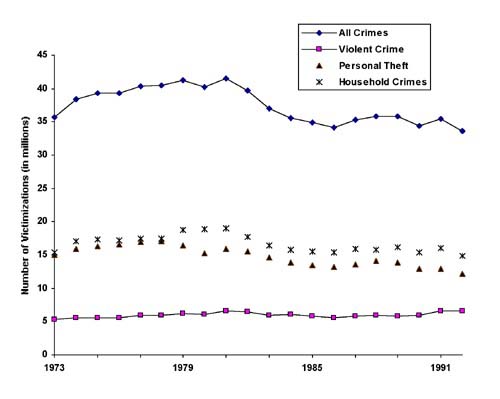 Figure 6.1 Victimization Levels for Selected Crimes: 1973-1992
Source: U.S. Department of Justice (1994c), table 1.9.
Relationship Between Alcohol and Drug Use and Crime
There exists a very strong empirical and conceptual association between criminal activity and the abuse of alcohol or illicit drugs, although there is little consensus about the nature of this relationship. Studies of arrestees and criminal justice populations consistently find high rates of alcohol and illicit drug use. Self-reported information from inmates confirms the strong association between drug use and crime. According to self-reports from a 1991 survey with a sample of 14,000 State and 6,600 Federal prison inmates, 24 percent of Federal inmates and 49 percent of State inmates reported that they were under the influence of alcohol or illicit drugs at the time of their current offense (U.S. Department of Justice 1994e). In State prisons, 32 percent of inmates reported they were under the influence of alcohol, and 31 percent reported they were under the influence of drugs (including 14 percent who were under the influence of both) when they committed their current offense.
Information obtained from arrestees provides additional evidence of the empirical association between drug use and crime. The Drug Use Forecasting (DUF) program operated by the National Institute of Justice conducts interviews and urinalyses in inner-city lockups of sampled male arrestees in 23 cities and selected female arrestees in 20 cities. Unfortunately, it is somewhat difficult to generalize DUF data because it is concentrated on inner-city arrestees. Still, DUF data from 1993 indicate that across the cities, the percentage of arrestees who tested positive for illicit drug use (any one of the following: opiates, cocaine, marijuana, amphetamines, LSD, or PCP) at the time of arrest ranged from 54 percent to 81 percent for male arrestees and from 42 percent to 83 percent for female arrestees (U.S. Department of Justice 1994d). Rates for males and females by type of crime are presented in table 6.6.
Despite, or perhaps because of, the strong association between drugs and alcohol and crime, social scientists, in an effort to develop better crime prevention strategies, have labored to develop and test theories that explain why and how this relationship exists. A useful beginning can be found in the basic observation that there are different types of crime. For example, violent crime is different from acquisitive or income-generating crime. Also, within violent crime, there are systemic factors involved that relate to the violent nature of the illegal drug trade (or to the illegal alcohol trade during Prohibition). A simplified framework for relating different types of crime to different effects of drugs has been proposed by Goldstein (1985).
The Goldstein system proposes a system of three models - psychopharmacological, economic, and systemic - which are hypothesized to represent the possible primary causal relationships between drugs and violence (these models can be generally extended to all types of crime). In his tripartite framework, Goldstein acknowledges that many factors probably combine to influence behavior. Moreover, as addressed in discussions of causality through this document, it is also very possible that underlying factors may contribute to a person both using alcohol and drugs and exhibiting criminal behaviors without there necessarily being a causal link between the two behaviors. Goldstein proposes that the psychopharmacological, economic, and systemic models can interact with all of the other factors, while still retaining their ability to explain criminal behaviors in relation to alcohol and drug use.
Psychopharmacological model. The psychopharmacological model suggests that "some individuals, as a result of short or long term ingestion of specific substances, may become excitable, irrational, and may exhibit violent behavior" (Goldstein 1985). The model hypothesizes that drugs may contribute to both violent behaviors and to the likelihood of a person becoming a victim of such behavior. This hypothesis also holds out the potential for some psychoactive substances to reduce violent behavior.
Economic model. The economic compulsive model suggests that "some drug users engage in economically oriented violent crime (e.g., robbery), in order to support costly drug use." Goldstein notes that heroin and cocaine, because of the "compulsive patterns of use" and relative costs associated with these drugs, are especially relevant to this model.
Systemic model. The systemic model suggests that "violence is intrinsic to involvement with any illicit drug." Goldstein defines systemic violence as "traditionally aggressive patterns of interaction within the system of drug distribution and use." For example, violence may be used to block competition, to punish drug dealers for selling poor-quality drugs, to collect unpaid debts, or to intimidate potential informants. According to this model, involvement in drug distribution could increase the likelihood of perpetrating or being victimized by violence.
This system does not so much propose new models or explanations for how abuse of alcohol and drugs might be related to types of crime as it recognizes or identifies groups or classes of theories. For example, the psychopharmacological model does not identify specific drugs or particular neurological systems or mechanisms by which behavior may be affected. It does, however, recognize the broader type of phenomenon that might be involved. The strength of the theory lies in suggesting the type of phenomena that other investigators ought to explore.
Alcohol
Extensive data are available that show a strong relationship between alcohol and crime - particularly violent crime. During the past two decades, research has discovered mechanisms and effects strongly suggesting that alcohol consumption plays a material, causal role in violent behaviors.
Using Goldstein's tripartite model, alcohol links well to the psychopharmacological model. Serotonin is a chemical by which nerve cells communicate with one another, and it regulates many chemical processes in the brain. Alcohol increases brain serotonin function temporarily, but thereafter, serotonin levels drop below normal levels (Pihl and Peterson 1993). This reduction in brain serotonin function is "associated with heightened vulnerability to depression, increased risk of violent suicide, propensity to exhibit aggressive or impulsive behavior, and susceptibility to alcohol abuse" (Pihl and Peterson 1993). These properties are strongly indicative of a causal link between alcohol abuse and violence, even though alcohol is only one factor among many that have been found to contribute to violence and aggressive behavior.
Numerous studies have found that "problem drinkers, alcohol abusers, and alcoholics appear to be over-represented among adults convicted of violent crimes, and people convicted of violent crime often report alcohol consumption immediately prior to their crime" (White et al. 1993). Furthermore, research demonstrates that the degree of aggressive response is proportional to the amount of alcohol consumed (Taylor 1993). Empirical data on jail and prison inmates suggest that alcohol consumption also appears to be associated with violence. Inmates are more likely to have been under the influence of alcohol prior to a violent crime than for an economic crime or other types of crime, except for alcohol-defined offenses (see table 6.7). Still, other theories suggest that these patterns only represent association, not causation.
Conversely, alcohol does not fit within the economic compulsive model that Goldstein proposes. Alcohol is relatively inexpensive, and economic crimes, such as robbery or theft, would not be necessary for persons to acquire quantities of alcohol. Furthermore, alcohol is legal, easily accessible, and available (for people 21 and older) and thus does not fit the systemic component of Goldstein's model. (However, during Prohibition, alcohol was illegal, and violence was associated with its manufacture and distribution.)
Illicit Drug Use
The evidence regarding drug-induced pharmacological violence suggests that psychoactive drugs do not stimulate violent behavior in any systematic manner (U.S. Department of Justice 1994f). While abuse of certain drugs may be associated with violent behaviors, Goldstein notes that some drugs, such as heroin or tranquilizers, may have a "reverse psychopharmacological effect and ameliorate violent tendencies." In such instances, some individuals may be self-medicating by using these drugs.
Research provides strong evidence supporting the economic model of drugs and crime. Goldstein points out that "research indicates that most crimes committed by most drug users are nonviolent (e.g., shoplifting, prostitution, and drug selling)." Studies conducted in the 1960's and 1970's suggested that income-generating crime, such as property crime, was the most predominant narcotic drug-related crime (U.S. Department of Justice 1980). Later research confirmed this association and demonstrated, for example, that criminal activity among heroin addicts declined sharply during nonaddiction periods (Ball et al. 1981). Yet recent research suggests that these patterns may be changing and that more frequently, abusers of narcotics (including opiates, such as heroin) engage in drug distribution crimes (Nurco et al. 1991). The relationship between use of nonnarcotic drugs (such as cocaine or hallucinogens) and crime is unclear. However, several studies conclude that cocaine use has been strongly associated with virtually all types of crime, including drug distribution, theft, violence, and confidence games (Nurco et al. 1991).
Goldstein suggests that systemic violence is an essential factor in drug distribution, but other social and economic factors may also contribute to and account for the level of violent activity. Areas that experience higher levels of drug trafficking activity also lack social organization, have high rates of interpersonal violence, and are economically disadvantaged. Yet this association could be attributed to the presence of drug markets that are a precursor to or a result of the aforementioned social and economic factors contributing to the deterioration of that area (Collins 1990). Frequently, drug-related violent crimes, such as homicides and assaults, are linked to drug marketing activities (e.g., disputes among rival distributors or between buyers and sellers of drugs) (U.S. Department of Justice 1994f). For example, of the 347 drug-related homicides reported in New York City in 1984, 67 percent were in drug locations and were generally in areas where drugs were sold (U.S. Department of Justice 1992a).
Studies of criminal justice populations strongly suggest that alcohol and drug use are associated with different types of crime, but it is important to distinguish among the various types. Drawing on Goldstein's framework, these types of crime can include violent crime, economic crime, and systemic crime. The evidence suggests that dependence on an expensive drug generates economic motives that play a strong role in income-generating criminal activity. Although the relationship between illicit drug use and violence is very poorly understood, it can be stated with some certainty that some systemic violence is associated with the drug trade.
Percent of Crime Attributed to Alcohol and Drug Abuse
The brief review of data and theory about the relationship of drugs and alcohol to crime suggests several conclusions. First, both theory and evidence support attribution of a material proportion of income-generating property crimes to drug abuse. The same assertion can be made about the involvement of alcohol with violent crimes. Whereas there is substantial evidence linking drugs with violent crime and alcohol with property crime, the theoretical and evidentiary foundations for developing quantitative estimates of these relationships are not strong. Consequently, as for the prior major cost studies on alcohol and drug abuse, the objective has been to select plausible attribution factors.
The attribution factors used in this study for the drugs and crime relationship are based on interviews with inmates in prisons and jails. For the alcohol and crime relationship, this study has adopted the general approach of Cruze et al. (1981), which attributes about one-half of the violent crimes in which the perpetrator had been drinking alcohol and one-tenth of the property crimes. Drug-defined crimes (e.g., dealing, trafficking, and possession) and alcohol-defined crimes (e.g., driving under the influence, public drunkenness, and liquor law violations) are attributed at 100 percent.
The rationale for using the Cruze et al. approach to develop attribution factors has primarily been one of default. There have been more data collected about the involvement of alcohol and drugs in crime (studies of association) since 1981. Recent studies theorize about causality, but there is an absence of empirical studies suggesting major changes in causality factors. The interested reader should see recent major reviews prepared for the National Institute on Alcohol Abuse and Alcoholism (Alcohol Health & Research World 17(2), 1993; Martin 1993; and the U.S. Department of Justice 1992a) that have reexamined the data on these issues. This study elects to make use of the new data on association but to retain the prior approach to translating those data into attribution factors.
Alcohol and drug abuse attribution factors used in this study are presented in table 6.8. About 30 percent of inmates incarcerated for robbery, burglary, and larceny indicated that they committed the crime for which they were incarcerated in order to get money for drugs. About 2 to 5 percent of those incarcerated for violent offenses made the same attribution. However, the new attribution factor of 15.8 percent for drugs and homicide has been drawn from detailed data about the nature of murder circumstances and the relationship of offenders and victims compiled by the U.S. Federal Bureau of Investigation (U.S. Department of Justice 1994b). Homicides in which drugs are explicitly listed as a factor, plus "juvenile gang" and "gangland" killings, represented 15.8 percent of homicides for which circumstances could be identified. This rate is applied to all homicides, although the rate may be too low because it is likely that a higher proportion of homicides with unknown circumstances may have also involved drug dealing and trafficking.
The drug attribution factors are somewhat, but not significantly, different from the estimates that have been used since Cruze et al. (1981). Those estimates made no attribution for drug-related violence (although a factor was included in Harwood et al. 1984). The factors for predatory and consensual crimes were also drawn from self-reported drug use by prison inmates. It was assumed that all daily heroin users were drug motivated and that 20 percent of daily users of other drugs were so motivated.
Alcohol attribution factors are very similar to those developed by Cruze et al. (1981). The methodology used is the same; however, current data have been obtained from the 1991 Survey of Prison Inmates (U.S. Department of Justice 1994e) to replace data originally obtained from the 1974 survey. Again, the approach is to attribute to alcohol about 50 percent of violent crimes where the perpetrator had been drinking (a total of about 30 percent of homicides and assaults and 22.5 percent of sexual assaults). One-tenth of property crimes where the perpetrator had been drinking are attributed, which is about 3 to 4 percent of all such crimes. In table 6.8, it can be observed that alcohol attribution factors - based on prisoner-reported rates of alcohol use by perpetrators - have fallen somewhat from the early 1970's. The factor for robbery fell from 3.9 to 3.4 percent (meaning that 39 percent of robbery inmates were drinking at the time of their crime in the early 1970's, compared with 34 percent of inmates in 1991). Somewhat greater decreases in rates - by about one-fourth - occurred for burglary, larceny, and auto theft between the early 1970's and 1991. Again, the alcohol causal factors for these crimes presented in table 6.8 are only 10 percent of the proportion of perpetrators reported under the influence of alcohol at the time of their arrest.
Note that the same causal factors that are applied to costs of offenders are applied to costs of victims. This may introduce an unknown direction and amount of bias. In the absence of data to the contrary, estimates reported in this study reflect the assumption that offenders in alcohol- and drug-related crimes are neither more nor less likely to be apprehended, prosecuted, convicted, and incarcerated (or put on probation) than are offenders in crimes that are unrelated to alcohol or drugs.
Criminal Justice System and Victim Costs Attributed to Alcohol and Drug Abuse (Excluding Health- and Productivity-Related Costs)
The estimated economic costs of crime attributable to drug abuse in 1992 were $18.4 billion (see table 6.9). The costs attributable to alcohol abuse were $6.4 billion. There are a number of different dimensions to these costs, all of which have been discussed in prior studies (e.g., Cruze et al. 1981; Harwood et al. 1984; Rice et al. 1990). The specific methodologies by which these costs have been calculated were detailed in those studies and therefore are not summarized in detail in this report. However, the detailed data and tables used for all the calculations appear in appendix C, tables C.1 to C.7, and these are also directly comparable to tabulations in the prior studies.
The costs of crime caused by alcohol and drug abuse that are discussed in this section include public and private expenditures for criminal justice services and protection and economic costs to victims not including the value of assets transferred from victims to perpetrators. These costs are summarized in table 6.9 and discussed in the text that follows. Tables detailing data, methodology, and sources of data used to compute each cost category follow this discussion.
Criminal justice system costs include expenditures for police protection; legal and judicial services; and Federal, State, and local correctional institutions. Expenses for police protection equal $6.2 billion ($4.6 billion for drugs and $1.5 billion for alcohol), representing almost one-third of the total alcohol and drug criminal justice expenses. Legal and adjudication costs were $1.7 billion; State and Federal correction costs were $8.5 billion; and local correction costs were $3.5 billion. In all categories except local corrections, the majority of the costs were due to drug abuse - local corrections deals extensively with driving under the influence and alcohol-related public disorder cases.
Actual Federal drug control expenditures for 1993 were $3.7 billion (excluding costs for the criminal justice system and drug treatment programs) (Office of National Drug Control Policy 1994). Drug law enforcement and control of drug traffic involve numerous Federal agencies. In addition to the Drug Enforcement Administration within the Department of Justice, Federal funds for drug control are distributed among agencies within the Departments of Agriculture, Defense, Education, Health and Human Services, Interior, Labor, State, Transportation, and Treasury. An additional $62 million was spent on alcohol control and licensing by the Bureau of Alcohol, Tobacco, and Firearms.
Private legal defense services for those accused of crimes that are attributable to drug and alcohol abuse were $416 million. The total annual revenue for legal services for 1992 was $108.4 billion (U.S. Bureau of the Census 1994). However, only about 2.6 percent of lawyers practice criminal law (this percentage of members of the American Bar Association belong to the criminal law section). This was allocated to alcohol and drug abuse (and nonalcohol and nondrug offenses) in proportion to the total of police protection services.
Victims of crime often incur medical expenses and/or damaged property. In 1992, medical services cost an estimated $400 million for injuries resulting from alcohol-related crime and $105 million from drug-related crime. These values, which represent health care costs, are included in chapter 4. Drug-related crimes cost about $193 million in property damage; alcohol-related crimes cost about $28 million in property damage.
- Table 6.1: Other Effects of Alcohol and Drug Abuse on Society, 1992
-
Table 6.1: Other Effects of Alcohol and Drug Abuse on Society, 1992 (millions of dollars) Cost Total Alcohol Drugs Value of Goods and Services Crime $24,282 $6,312 $17,970 Social welfare $1,020 $683 $337 Motor vehicle crashes $13,619 $13,619 - Fire destruction $1,590 $1,590 - Total, Direct Costs $40,511 $22,204 $18,307 Lost Productivity Victims of crime $3,071 $1,012 $2,059 Incarceration $23,356 $5,447 $17,907 Crime careers $19,198 $19,198 Total, Indirect Costs $45,625 $6,459 $39,164 TOTAL $86,136 $28,663 $57,471 Source: Analysis by The Lewin Group.
Note: Components may not sum to totals because of rounding. Other costs resulting from alcohol- and drug-related crime, motor vehicle crashes, and fires (e.g., health care costs, premature death) are estimated and reported elsewhere in this report. Estimation of crime-related lost productivity attributed to alcohol and drug abuse is described in chapter 5, section 5.6.
-
Table 6.2: Total Costs of Alcohol and Drug Abuse-Specific and Related Crime, 1992 (millions of dollars) Cost Total Alcohol Drugs Value of Goods and Services Criminal Justice System Police protection $6,191 $1,547 $4,644 Legal and adjudication $1,701 $491 $1,210 State and Federal correction $8,483 $1,790 $6,693 Local correction $3,517 $2,326 $1,191 Total, Criminal Justice System $19,892 $6,154 $13,738 Federal Drug Traffic Control $3,753 $62 $3,691 Total, Public Expenditures $23,645 $6,216 $17,429 Private legal defense $416 $68 $348 Economic costs to victims
[Medical expenses for victims of violent crimes, counted elsewhere][$505] [$400] [$105] Property damage $221 $28 $193 Non-Government Expenditures $637 $96 $541 Subtotal, Medical Not Included1 $24,282 $6,312 $17,970 Lost Productivity (Earnings)2 Victims of crime $3,071 $1,012 $2,059 Incarceration $23,356 $5,449 $17,907 Crime careers $19,198 - $19,198 Subtotal $45,625 $6,461 $39,164 TOTAL $69,907 $12,773 $57,134 Source: Analysis by The Lewin Group.
Note: Components may not sum to totals because of rounding. Other costs resulting from alcohol- and drug-related crime (e.g., health care costs, losses from homicides) are estimated and reported elsewhere in this report.
1Medical expenses from violent crimes are included in chapter 4 as a health consequence of alcohol and drug abuse.
2Estimation of crime-related lost productivity attributed to alcohol and drug abuse is described in chapter 5, section 5.6.
- Table 6.3: Number of Known Criminal Offenses, 1993
-
Table 6.3: Number of Known Criminal Offenses, 1993 Type of Offense Number of Known Offenses Homicide 24,526 Assault (aggravated) 1,135,099 Robbery 659,757 Burglary 2,834,808 Larceny-theft 7,820,909 Auto theft 1,561,047 Rape 104,806 Source: U.S. Department of Justice (1994b), table 30, p. 218.
- Table 6.4: Number of Known Criminal Arrests, 1993
-
Table 6.4: Number of Known Criminal Arrests, 1993 Type of Offense Number of Known Offenses Driving under influence 1,229,971 Liquor laws 419,082 Public drunkenness 604,979 Stolen property 134,864 Prostitution 88,850 Drug laws 968,606 Source: U.S. Department of Justice (1994b), table 30, p. 218.
- Table 6.5: Dollar Losses by Type of Crime, 1991
-
Table 6.5: Dollar Losses by Type of Crime, 1991 (millions of dollars) Type of Crime 1991 Gross Dollar Loss Personal crimes $4,569 Crimes of violence [$1,076] Crimes of theft [$3,493] Household crimes $14,529 ALL CRIMES $19,098 Source: U.S. Department of Justice (1993c), p. 16.
- Table 6.6: Illicit Drug Use by Booked Arrestees in 24 Selected Cities, by Charge at Arrest, 1991
-
Table 6.6: Illicit Drug Use by Booked Arrestees in 24 Selected Cities, by Charge at Arrest, 1991 Charge Males Testing Positive
(%)Females Testing Positive
(%)Homicide 48 65 Assault 48 50 Robbery 65 76 Burglary 68 63 Larceny-theft 64 58 Sex offense 37 68 Stolen property 58 74 Prostitution 47 85 Drug sale/possession 79 79 Source: U.S. Department of Justice (1991a).
- Table 6.7: Percentages of Inmates Who Used Alcohol and Other Drugs Prior to a Criminal Offense
-
Table 6.7: Percentages of Inmates Who Used Alcohol and Other Drugs Prior to a Criminal Offense Offense Jail Inmates (%)
Committed Offense Under the Influence of:Prison Inmates (%)
Committed Offense Under the Influence of:Alcohol Only Drugs Only Alcohol & Other Drugs Alcohol Only Drugs Only Alcohol & Other Drugs Robbery 18 18 17 15 19 18 Assault 44 5 10 27 8 14 Property offenses 18 18 13 18 21 14 DWI 83 2 10 70 3 8 Drug offenses 7 29 12 8 26 10 Average for All Offenses 29 15 12 18 17 14 Sources: U.S. Department of Justice (1991b), table 3.3; (1993d), p. 26.
- Table 6.8: Causal Factors for Alcohol and Drug Relationship to Crime: Comparison of Factors in Current and Prior Studies
-
Table 6.8: Causal Factors for Alcohol and Drug Relationship to Crime: Comparison of Factors in Current and Prior Studies (percent of crimes attributed, by type of crime) Type of Crime Alcohol Factors Drug Factors Current Study Prior Studies Current Study Prior Studies Homicide 30.0 30.0 15.8 10.0 Aggravated assault 30.0 30.0 2.4 10.0 Sexual assault 22.5 22.5 5.1 10.0 Other assaults 30.0 0.0 5.1 0.0 Robbery 3.4 3.9 27.2 26.8 Burglary 3.6 4.7 30.0 22.4 Larceny-theft 2.8 3.8 29.6 18.6 Auto theft 3.5 4.6 6.8 18.6 Driving under the influence 100.0 100.0 0.0 0.0 Liquor laws 100.0 100.0 0.0 0.0 Public drunkenness 100.0 100.0 0.0 0.0 Stolen property 0.0 0.0 15.1 18.6 Prostitution 0.0 0.0 12.8 12.8 Drug laws 0.0 0.0 100.0 100.0 Source: Analysis by The Lewin Group.
Note: "Prior studies" refers to identical factors used in Cruze et al. (1981); Harwood et al. (1984); and Rice et al. (1990).
-
Table 6.9: Total Public and Private Costs of Alcohol and Drug Abuse-Specific and Related Crime, 1992 (millions of dollars) Cost Total Alcohol Drug Criminal Justice System Police protection $6,191 $1,547 $4,644 Legal and adjudication $1,701
$8,483$491
$1,790$1,210
$6,693Local correction $3,517 $2,326 $1,191 Total, Criminal Justice System $19,892 $6,154 $13,738 Federal Drug Traffic Control $3,753 $62 $3,691 Public Expenditures $23,645 $17,429 Private Legal Defense $416 $68 $348 Economic costs to victims
[Medical expenses for victims of violent crimes, counted elsewhere][$505] [$400] [$105] Property Damage $221 $28 $193 TOTAL (Medical not included)1 $24,282 $6,312 $17,970 Source: Analysis by The Lewin Group.
Note: Components may not sum to totals because of rounding.
1Medical expenses from violent crimes are included in chapter 4 as a health consequence of alcohol and drug abuse.