Certain types of medical consequences of alcohol or drug abuse are underrepresented in the hospital and ambulatory care costs described in section 4.2. These include the full cost of treatment for fetal alcohol syndrome (FAS), psychiatric comorbidity, drug-exposed babies, HIV/AIDS, tuberculosis, and hepatitis.
Fetal Alcohol Syndrome
This study uses recent estimates that 2.0 per 1,000 live births have FAS and that it cost an estimated $1.9 billion in 1992 to treat infants, children, and surviving adults for FAS and its sequelae.
Synopsis
FAS is estimated to occur in 2.0 per 1,000 live births in the United States each year (Bloss 1995, personal communication). It is estimated that during 1992, the cost of treating FAS-affected infants, children, and adults was $1,944 million. Most of the cost associated with FAS treatment is incurred while developmentally disabled persons are either institutionalized or receiving intensive home-based services during their adult years. This estimate does not include other effects that result from fetal alcohol exposure that has not been diagnosed as FAS.
Fetal Alcohol Syndrome in the United States
FAS was first identified in the United States in 1973 (Jones and Smith 1973). The effects of fetal alcohol exposure range from morphological abnormalities to mental impairment. Abel and Sokol (1987) defined features of the syndrome to include growth deficiency; anomalies of brain structure and function, including intellectual deficits; and abnormalities of the head and face. Sokol and Clarren (1989) expanded this definition to include neurological abnormalities, developmental delays, and behavioral dysfunction. Sokol and Clarren also specified the facial abnormalities to be short eye openings; a thin upper lip; an elongated, flattened midface; and an indistinct groove in the middle of the upper lip. Streissguth et al. (1991) found that 58 percent of children born with FAS are later diagnosed as developmentally disabled.
Documenting the prevalence of FAS is very difficult. First, it is difficult for physicians to recognize features that define FAS and attribute them to a stigmatized disorder, rather than to other causes. Second, it may take time for FAS features to become apparent. For example, neurobehavioral and cognitive deficits may not become apparent for many years. Three methodological approaches have been used to estimate the incidence of FAS in the United States as follows:
- "Catchment" approach, where birth defects are monitored at the time of birth only;
- Review of retrospective studies, where children are identified as having FAS at some point after birth; and
- Review of prospective studies, where children are followed over time and assessed at various intervals from birth onward (Warren 1995).
Studies of babies (less than 1 year old) are necessary to document the impact of alcohol on the basal ganglia. Studies of older children (3 to 6 years old) are necessary because many of the features or symptoms of FAS (e.g., mental development) do not become manifest or diagnosable until that age (Warren 1995), whereas others, such as facial morphometric features, sometimes disappear.
The Centers for Disease Control and Prevention (CDC) used a catchment approach to arrive at an estimated FAS rate of 0.67 cases per 1,000 births in 1993, which was up from 0.22 per 1,000 births found in 1987. However, the CDC approach relied on documentation of ICD-9 diagnostic category 760.71, "noxious influences affecting fetus via placenta or breast milk, specifically alcohol; includes fetal alcohol syndrome." This category includes fetal alcohol effects as well as FAS. Moreover, the CDC study collected these data for newborns only. Finally, staff at the CDC Survey and Statistics Branch noted that physician diagnostic practices were not uniform and that increases in the reported incidence rate between 1987 and 1993 could have been partly due to better recognition, diagnosis, and awareness of FAS among physicians.
Researchers have used retrospective and prospective methodologies to estimate the incidence of FAS, to differing ends. Abel and Sokol's (1987) review of 19 retrospective and prospective epidemiological studies collected from around the world found that retrospective studies yielded a rate of 2.9 per 1,000 births, whereas prospective studies identified 1.1 per 1,000 births. On average, Abel and Sokol have concluded that FAS occurs in 1.9 per 1,000 births. Scientists, including NIAAA researchers, caution that retrospective and prospective studies may overestimate FAS incidence by oversampling populations in which FAS incidence is unusually high. When high-risk populations were removed, Abel and Sokol (1991a) found that only 0.33 per 1,000 births had FAS.
Some studies suggest that race/ethnicity is a factor in the incidence rate. Abel and Sokol (1987) reviewed one study that found 3.0 cases of FAS per 1,000 births among African-Americans in Cleveland; May et al. (1983) found 10 cases of FAS per 1,000 births among certain specific Native American subpopulations who were identified as "high risk" for socioeconomic reasons. It is also important to note that the calculation of the FAS incidence rate may be affected by an overstatement of the number of FAS cases in certain communities (e.g., Native Americans). This overstatement is in part due to a bias in diagnosis that occurs because of a lack of knowledge of the regular morphological features of Native Americans (Aase 1994). This "misdiagnosis" occurs because health professionals are not familiar with the similarities of non-FAS-affected Native American facial characteristics (particularly Native Americans from the Southwest) in comparison with facial characteristics typical of a Native American with FAS.
An Institute of Medicine report issued in 1996 (Stratton et al. 1996) concluded that the incidence rate of FAS falls between 0.5 and 3.0 per 1,000 in the general population, or 1 case per every 333 to 2,000 live births. Estimates of the costs associated with FAS used in this report are developed based on a conservative rate of 1 in 500 (2.0 per 1,000) live births, which is consistent with the Institute of Medicine findings. This also represents a midpoint in the range of estimates found by Abel and Sokol and is close to the 1.9 per 1,000 births that was previously reported. This rate may increase in coming years as more health professionals diagnose and record FAS cases (Warren 1995).
The Costs of Treating Fetal Alcohol Syndrome
Previous Studies
Previous studies have explored the costs of treating FAS. For example, Russell (1980) estimated the costs of treating FAS in New York State in 1978. Later studies expanded on Russell's work, including a Research Triangle Institute study in 1985 (Harwood and Napolitano 1985) and estimates by Rice et al. (1990) and Abel and Sokol (1987, 1991a,b). The cost categories included in estimates of the costs of treating FAS vary across these studies. Generally included, however, are the costs of care for low-birthweight babies, surgical correction of FAS-related birth defects (e.g., cleft palate), heart defects, auditory defects, and moderate or severe mental retardation. A comprehensive list of health care services related to treatment and care for individuals with FAS is presented in table 4.12.
Many limitations in studies of the effects of FAS suggest that further research is needed to confirm existing conclusions. For example, physical deformities, which have been identified as a priority among FAS cases, may in fact be much less complicated to rectify than certain neurobehavioral effects. Weiner and Morse (1994) have also reported on some methodological problems in the FAS studies conducted to date. These methodological problems stem from experimental bias due to the study of the most severe FAS cases, lack of a control group, small sample sizes, and cognitive measurements taken only once or twice during the developmental continuum.
Some apparent consequences of FAS may self-remediate, whereas other "symptoms" of FAS may occur in a person without FAS having been a causal factor. Ventricular septal defects may disappear with time (Streissguth and Giunta 1988). Conversely, conditions such as cleft palate and hearing loss may be found among FAS sufferers, but the conditions themselves were not necessarily brought on by FAS (American Cleft Palate-Craniofacial Association 1993). Estimates of "background prevalence" of these conditions have been used to adjust downwardly the incidence of these problems attributed to FAS in this analysis.
Some of the conditions previously attributed to FAS have been dropped from this analysis, but future analyses may need to add certain categories. Heart defects, for example, were dropped from this analysis because experts have reported low frequency and because heart defects have a tendency to self-remediate. One category that should be added in future studies is psychological testing and services for FAS children and their families. Streissguth and Giunta (1988) found that 62 percent of FAS children are hyperactive and often manifest symptoms of antisocial personality disorder or other mental health problems (aside from developmental disabilities). More data on the incidence and severity of psychological sequelae associated with FAS are needed, however, before this category may be added.
Harwood and Napolitano (1985) estimated the cost for FAS care and services in 1980 to be $3.2 billion. In addition, Harwood and Napolitano estimated the lost productivity due to mental retardation. According to the study, for a midrange incidence rate of FAS (1.6 cases per 1,000), lost productivity amounted to $853 million in 1980. Abel and Sokol (1987) estimated the cost of treatment for FAS to exceed $321 million, not counting supported and institutional living for adults older than age 21. Rice et al. (1990) did include residential care for mentally retarded adults and estimated the direct-care costs to be $1.61 billion in 1985. Residential care in the Rice et al. (1990) study accounted for almost 80 percent of total direct costs of FAS. Abel and Sokol (1991b) reestimated the cost in 1991 to be $249.7 million.
Based on the dissimilarities and limitations in cost components captured in major studies completed to estimate the costs of FAS, the most accurate assessment of costs based on these studies could come from a comparison of the first-year costs emanating from the studies. However, the initial and subsequent research of Abel and Sokol does not specify the sequence of treatment of several of the organic anomalies associated with FAS. This is also true for the Rice et al. (1990) study, which is based on the work of Abel and Sokol. Abel and Sokol (1987) also point out that different levels of facial abnormalities as well as different levels of mental retardation contribute to differences in cost. Further, the later Abel and Sokol studies (1991a,b) identified additional organic abnormalities (e.g., spina bifida) that were not captured in the earlier study. The potential for inconsistencies across the studies in identifying "true" first-year cost components precludes the possibility of a comparative analysis of first-year costs.
Estimating the Cost of Fetal Alcohol Syndrome for 1992
To calculate the costs of FAS for 1992, this study reestimated (1) the nature and cost of specific types of treatment, (2) the proportion of FAS cases requiring services, and (3) the duration of services. Recent literature on the effects of fetal alcohol exposure and FAS were reviewed, and experts were contacted to lend judgment concerning the data. This study assumes that 2.0 per 1,000 live births in 1992 had FAS and that 2.0 per 1,000 persons up to age 20 were born with FAS (note that Harwood and Napolitano [1985] found no excess mortality among the FAS population in this age group). This study also assumes that 1.0 per 1,000 persons over the age of 20 had FAS: This assumption reflects generally lower rates of drinking among expectant mothers prior to 1973. Based on the assumptions described in table 4.13, the direct cost of FAS in 1992 is estimated to be $1.9 billion.
Conclusion
This study benefited from a lengthy and vigorous debate over the extent of FAS in the United States during the past 20 years and relies on the NIAAA estimate of 2.0 cases per 1,000 live births. Additional research is required, however, in examining the differences across racial and ethnic lines found in the United States. Additional research is also needed concerning the long-term effects of FAS on cognitive and physical development and the degree of assistance that FAS sufferers require throughout the course of their lives. Additional data on the proportion of persons with varying degrees of developmental disability treated in ambulatory and inpatient settings or through home-health arrangements, their respective costs, and their durations all require further exploration.
In addition to the previously identified cost components, the social costs of FAS have not been fully explored. For example, the quality of life of individuals with FAS has not been studied. Another area for further study is the effect of familial environment on the FAS victim and on the progression and treatment of his or her condition. Finally, Streissguth (1994) points out that 58 percent of FAS victims are mentally retarded, but often these individuals and their families cannot find or access support services within their community. Streissguth (1994) also found that borderline retardation may be related to other specific problems, such as delinquency and criminality. Research into the costs associated with fetal alcohol effects (not diagnosable as FAS) is also needed; these costs have not been included in this analysis.
Drug-Exposed Infants, Boarder Babies, and Abandoned Infants
It cost about $407 million in extra hospital costs to treat drug-exposed infants and to house abandoned babies in 1992.
Synopsis
Newborns and infants may experience extra hospital stays as a result of drug abuse for at least two reasons: (1) complications due to pre- or perinatal drug exposure and (2) the need for temporary shelter when abandoned. This study estimates that drug exposure resulted in an additional $360 million in hospital costs for newborns and that "boarder babies" cost an additional $47 million for housing beyond what is medically required. A newborn with exposure to cocaine and one or more other drugs had increased hospital costs of $7,731, and cocaine-only exposure is related to $1,223 in additional costs. Boarder babies cost about $586 per day beyond the date medically cleared for discharge, with an average of 11 days of extended hospital stay per boarder baby.
Drug-Exposed Infants: Prevalence
Recent estimates place the number of infants exposed in utero to one or more illegal drugs at between 625,000 to 729,000 per year (about 15 to 18 percent). Testing of newborns yields lower rates: A survey for California found that 5.2 percent of newborns tested positive for exposure (adjusted to the U.S. demographic distribution, this is 7 percent or 287,800 newborns).
Drug consumption by the mother may or may not have serious repercussions for the fetus. The next section discusses sequelae of fetal drug exposure. In estimating the economic costs associated with drug-exposed infants, estimates of the prevalence of drug exposure must be supplemented with an assessment of the extent to which such exposure would produce medical or developmental consequences for affected fetuses and infants. Two variables may affect the impact of drug consumption on a fetus: (1) timing of the consumption relative to developmental stages of the fetus and (2) the quantity and frequency of drugs consumed. It is not known how many mothers of newborns have used drugs at intensive versus low levels; however, one recent study has estimated that about 105,000 of these women have used drugs to such an extent that they probably meet clinical criteria for needing treatment. The best documented effects of in utero drug exposure are primarily associated with cocaine exposure. There are no rigorous studies that support the contention that drug-exposed infants are more likely to suffer specific birth defects or patterns such as FAS.
A recent Department of Health and Human Services report to Congress found that for all of 1991, there were an estimated 10,000 boarder babies (newborns who are medically cleared for discharge but are held in hospital for nonmedical reasons). On a given day in 1991, about 300 boarder babies were in hospitals. Maternal drug abuse appears to be a major factor in this problem: An estimated 74 percent of the mothers of boarder babies had used drugs shortly before delivery, based on urinalysis or self-report. Detection of maternal drug use is often cause for delayed discharge, since child welfare services must assess the fitness of the parents and/or arrange for alternative living situations (foster care) before discharge.
Although no direct national-level estimates have been made of this problem, several studies have yielded "order-of-magnitude" estimates. Two studies have applied findings from the 1988 and 1990 National Household Surveys on Drug Abuse to estimate that 625,000 to 739,000 pregnant women illicitly used drugs. Studies of women delivering in particular hospitals have yielded rates ranging from several percent to more than 30 percent. Representative surveys in California, Ohio, and Rhode Island estimated by using urinalysis that 1.1 percent, 1.4 percent, and 1.4 percent, respectively, of newborns in those States had been recently exposed to cocaine.
Several limitations complicate estimates of the number of children born drug-exposed each year, and these limitations relate to both the data currently available and the methodologies used to obtain these data (CSAP 1994; Gomby and Shiono 1991). For example, no national-level studies have been conducted on the prevalence of prenatal drug exposure. Most data come from either small-scale studies conducted at the State, community, or hospital level or from national studies that assess alcohol, tobacco, and other drug use in the general population (CSAP 1994). Data collected in these studies can often either underestimate or overestimate the extent of the problem. For example, small-scale studies tend to occur in settings where prevalence is believed to be high, which yields unrepresentative prevalence estimates, whereas studies that focus solely on women who receive prenatal care and deliver their infants in a hospital can underestimate the true nature of the problem. Furthermore, most studies were conducted in urban areas, and data collected from urban studies are not representative of drug use for the whole country. Also, studies conducted in urban areas (particularly in inner-city hospitals) therefore overrepresent low-income populations and ethnic minorities, which probably yields overstated prevalence estimates among these populations.
Methodological problems also present challenges to developing accurate estimates for the prevalence of drug-exposed infants. Both the scientific technology and the sampling methodology used to gather data are subject to limitations and bias. Prevalence data are collected through either a drug test - given to the mother, the infant, or both - or through a mother's self-report of alcohol and drug use; ideally, a comprehensive survey would collect information using both methods. Sensitive scientific tests such as blood and urine analyses can only detect alcohol and drug exposure within a narrow timeframe and, as a result, are often inaccurate (Gomby and Shiono 1991; CSAP 1994). For example, urine tests used to detect cocaine use only work within 48 hours of the last time of use. In addition, tests can only detect a single substance, and a significant number of drug-exposed infants have been exposed to multiple drugs, including alcohol and tobacco. As a result, scientific tests often present uneven results.
Self-reporting underestimates actual prevalence rates because women are more likely to deny alcohol and drug use during pregnancy for fear of losing their children to child protective services. Another obstacle to acquiring prevalence data is that there is no standard protocol for testing newborns for illicit substances, and testing methods often oversample low-income racial and ethnic minorities. Finally, medical professionals may not be trained or have up-to-date information concerning identification of drug abuse among expectant mothers.
Despite these limitations, several studies have attempted to estimate the number of alcohol- and drug-exposed newborns. Several national-level studies have addressed the number of women of childbearing age who use drugs and how many enter drug treatment. Women of childbearing age are defined as being between the ages of 15 and 44. In 1991, there were approximately 59 million women of childbearing age in the United States (S. Alford, Advocates for Youth, 1994, personal communication). Analysis of the National Household Survey on Drug Abuse (NHSDA) indicates that 10 percent of these women reported illicit drug use within the past year and 5 percent within the past month (National Institute on Drug Abuse 1991a). Women between the ages of 18 and 25 had the highest rates of drug use (27 percent in the past year; 13.3 percent in the past month), and marijuana was the most frequently used drug by women of all ages. A 1990 Institute of Medicine study estimated that 105,000 pregnant women per year were in need of drug treatment (Gerstein and Harwood 1990).
Despite the lack of available studies and the limitations in methodology for obtaining precise and conclusive data on drug-exposed infants, the information currently available does provide a baseline indication of the scope of the problem. Also, current data demonstrate that among those women who use and abuse illegal drugs, women of childbearing age are the age cohort most at risk (NIDA 1991b). Table 4.14 summarizes the results of several studies that have estimated the number of drug-exposed infants born annually.
A recent report by the U.S. Department of Health and Human Services (1993b) estimated that during 1991 there were 10,000 boarder babies (about 300 on a given day). About 74 percent of boarder babies were estimated to be drug-exposed, based on urinalysis testing or maternal self-reports. The data were collected from 851 hospitals across the Nation that were identified by State child welfare offices as possibly having boarder babies. Drug exposure was detected in most of the cases by drug testing both the mother and the infant, though in some cases only the mother or only the infant was tested. The authors suggest that the study may underestimate the true extent of the problem for two primary reasons. First, State child welfare agencies may be unaware of or reluctant to share information on the problem. Second, hospital staff are reluctant to divulge data for fear of losing Medicaid reimbursement, and hospitals lack consensus on deciding when an infant is ready for medical discharge. Most of the boarder babies and abandoned infants were concentrated in urban hospitals, and 75 percent of boarder babies and 67 percent of abandoned infants were African-American (U.S. Department of Health and Human Services 1993b).
Two surveys of treatment providers yield data on the number of women of childbearing age who enter drug treatment. The State Alcohol and Drug Abuse Profile (SADAP) from 1990 surveyed treatment units that received at least some funds administered by the State Drug Agency. SADAP reported 255,000 admissions of women, and of those, nearly 90 percent were of childbearing age (National Association of State Alcohol and Drug Abuse Directors 1994). SADAP provided no breakdown by ethnicity or gender for primary drug of choice, but cocaine, marijuana, and heroin were the drugs for which people primarily sought treatment. The National Drug and Alcoholism Treatment Unit Survey (NDATUS) from 1991, which included both private and publicly funded treatment units, found 132,000 women enrolled in drug or combined drug and alcohol treatment on any given day. Based on the NDATUS finding that the annual client count is about four times the daily census, this indicates that 528,000 women with drug or combined drug and alcohol problems were treated in 1991. No data were available to specify how many of these women were of childbearing age (SAMHSA 1993a), although it was reported that 4.9 percent of the women in treatment were pregnant - suggesting that 26,000 pregnant women were treated for drug or combined drug and alcohol problems in 1991.
The Effects of Prenatal Drug
The use and abuse of illegal drugs during pregnancy pose increased risks for a woman's health and the subsequent health of her child. Several issues complicate the ability of researchers to arrive at specific conclusions as to the effects of prenatal alcohol and drug exposure, including the following:
- Many children are exposed to a variety of risk factors, including polydrug use and exposure to alcohol and cigarettes, which makes it difficult to assess the impact of specific substances.
- Other risk factors, such as poverty, poor maternal health and nutrition, and unstable or violent home environments, also significantly affect the health and development of infants and children (CSAP 1994; Zuckerman 1993).
Analyses of the effects associated with prenatal drug exposure must not only focus on the medical and behavioral consequences of substances on the infant, but also acknowledge the role that other risk factors play in the health and development of children. Such factors include postnatal drug use/abuse and unstable and violent home environments. Research has also shown that symptoms of drug exposure seen at birth and in infancy do not predict adverse outcomes for later child development (CSAP 1994).
Studies that assess the effects of prenatal exposure of drugs identify a general range of effects among the sample population, but it is important to remember that individuals react to and break down drugs differently. Individual differences in the length of time a drug stays active in a person's system, the level of craving, and duration of the "high" all influence the effects that drug use/abuse has on the developing fetus (CSAP 1994). The following are some of the general effects of prenatal drug use on newborns and infants:
- Growth variations, including intrauterine growth retardation and low birth weight, reduced birth length, and reduced head circumference;
- Health risk, including increased risk for premature birth and/or low birth weight;
- Sudden infant death syndrome (opiate use is the single strongest factor);
- Withdrawal symptoms (specific to opiate use); and
- Neurological and neurobehavioral impairment.
Table 4.15 provides a summary of the effects of specific drugs on infants and newborns (CSAP 1994; Zuckerman 1993). Again, since many persons use or abuse more than one type of substance (including alcohol, drugs, and tobacco) during pregnancy, it is difficult to pinpoint the effect of a specific drug. For research purposes, however, researchers usually study the drug the sample population uses most frequently.
The Economic Impact of Drug-Exposed Infants, Boarder Babies, and Abandoned Infants
Limited data are available on the economic costs associated with drug-exposed infants. Estimates of the cost of treating drug-exposed infants find that most costs occur in neonatal intensive care units (NICU's) for treatment of complications of drug exposure. This study does not include long-term medical, social welfare, or educational costs related to prenatal alcohol and drug exposure.
A 1990 U.S. General Accounting Office (GAO) study estimated median hospital charges for each drug-exposed infant to be $1,100 to $4,100 higher than those for nonexposed infants. One researcher has multiplied these cost ranges and the Institute of Medicine's national prevalence estimates to arrive at yearly costs to treat drug-exposed infants that are between $385 million and $3 billion (Chasnoff 1991). These estimates should be treated with caution for several reasons. One reason is that not all drug-exposed infants require longer hospital stays and do not, therefore, necessarily incur costs above and beyond those of unexposed infants. Also, the GAO study does not distinguish between different types of drug use, and it is not clear whether marijuana was included in the study. Further, the study does not account for other risk factors such as prenatal care, alcohol use, and racial and ethnic background.
A study by Phibbs et al. (1991) estimates that $504 million in medical care costs are attributable to cocaine-exposed infants for 1990. It should be noted, however, that not every newborn and infant exposed prenatally to cocaine requires a longer hospital stay. Most of the costs were concentrated among a small percentage of newborns who required stays in the NICU. The study, which is based on data collected at Harlem Hospital from 1985 to 1986, arrived at its estimate by multiplying Gomby and Shiono's (1991) estimate of 158,000 cocaine-exposed children with an average neonatal hospital cost of $3,182. The study adjusted for other risk factors, such as race, maternal age, prenatal care, and maternal alcohol consumption. The study also controlled for cocaine and crack cocaine use, with crack cocaine resulting in much higher average costs in terms of medical treatment.
The study by Phibbs et al. (1991) may underestimate costs because it excludes physician costs, which tend to account for 15 to 20 percent of NICU costs, and because it considers only short-term hospital costs; also, the cost estimates depend on prevalence rates, which vary across prevalence studies. Conversely, the study may overestimate the costs associated with prenatal cocaine exposure. The sample population at Harlem Hospital had a much higher rate of crack cocaine use than the general population. Crack cocaine use as a percentage of total cocaine use among women of childbearing age is 13.3 percent, as opposed to 33 percent in the Harlem Hospital population. Adjusting the costs to account for this lower percentage of crack use in the general population yields an average yearly cost of around $310 million attributable to cocaine-exposed infants.
A 1994 study by Joyce et al. estimated that direct costs related to prenatal exposure to illegal drugs was $387 million for 1991. The study compared exposed and unexposed populations at a municipal hospital in New York City for a 6-month period, and the study categorized exposure as follows: cocaine exclusively; drugs other than cocaine - heroin, methadone, marijuana; and cocaine and some other drug. Although the study did not distinguish between cocaine and crack cocaine, it did adjust for factors such as prenatal care, race, and maternal age; 85 percent of the sample population was black. Sixty percent of the exposed sample used cocaine and some other drug, and this population accounted for most costs. On average, infants born exposed to cocaine and some other drug had a length of stay that was 7 days longer than that of unexposed infants and hospital medical costs that were $7,731 higher than those of unexposed infants. Infants exposed only to cocaine had a modest increase in length of stay and costs, whereas exposure to drugs other than cocaine had little impact on length of stay and direct costs. The study also reported that 60 percent of newborn costs were the consequence of adverse birth outcomes and newborn infection. The major limitation of the study is that its data and cost estimates came from a single institution and may not reflect national variations for direct medical costs.
The 1993 U.S. Department of Health and Human Services (1993b) report on boarder babies and abandoned infants suggests that care for boarder babies cost $22 million to $125 million in total. The report does not, however, supply a means to estimate what proportion of the costs is attributable solely to effects of drug exposure; rather, the study implicitly assumes that some of the costs relate to caring for drug-exposed infants. The costs of boarder babies were calculated by using actual hospital costs and contrasting mean and median lengths of stay past medical discharge. Median hospital charges above account for $22 million, although ancillary services plus accounting for very high-cost infants suggest that the true cost may be closer to $125 million.
In utero drug exposure of neonates - primarily to cocaine - is associated with generally poorer birth outcomes and associated hospital costs. However, there is little rigorous evidence and certainly no consensus that in utero drug exposure causes unique and specific birth defects or other health or behavioral problems, such as those identified with FAS, beyond the neonatal stage. General population studies suggest that 15 to 18 percent of women in their childbearing years use illicit drugs in a year (primarily marijuana). Urinalysis tests of mothers and infants at birth indicate 5.2 percent to 7.5 percent of mothers have used drugs.
Conclusion
Newborns and infants may experience extra hospital stays as a result of drug abuse for at least two reasons: (1) complications due to pre- or perinatal drug exposure and (2) the need for temporary shelter when abandoned. Averaging results from prior studies, this study estimates that drug exposure resulted in an additional $360 million in hospital costs for newborns and that boarder babies cost an additional $47 million for housing beyond what is medically required. A newborn with cocaine-plus-other-drug exposure had increased hospital costs of $7,731, and cocaine-only exposure was related to $1,223 in additional costs. Boarder babies cost about $586 per day beyond the date medically cleared for discharge, with an average of 11 days extended hospital stay per boarder baby.
Tuberculosis
Drug abuse-related behaviors are estimated to cause 2 to 7 percent of the tuberculosis cases in the United States each year, and the cost of treating these cases in 1992 is estimated to have been $30 million.
Synopsis
After 35 years in which the incidence of tuberculosis declined by an average of 6 percent per year, tuberculosis cases have increased each year since 1985. Between 1985 and 1991, 39,000 cases of tuberculosis occurred in excess of those expected based on previous trends. The Centers for Disease Control and Prevention (CDC) reported 26,673 cases of tuberculosis in 1992. Limited studies suggest that between 600 and 1,800 of these cases are related to drug use, or 2 to 7 percent of reported cases. This report uses a median of 1,200 cases, or 4.5 percent of annual cases.
For 1991, the CDC estimates that $617 million was spent on inpatient and outpatient costs for tuberculosis, of which $27.8 million is associated with drug use. Federal public health and research activities by CDC and the National Institute of Allergy and Infectious Diseases (NIAID) cost $50 million, of which 4.5 percent, or $2.25 million, may be allocated to drug abuse. CDC and NIAID funding will total $170 million in 1994. There is a risk that the incidence and the health care costs associated with tuberculosis may continue to climb with the recent increase in multiple-drug-resistant tuberculosis.
A recent CDC study (Bloch et al. 1994) determined that 14.2 percent of tuberculosis cases (472 out of a representative sample of 3,313 culture-positive tuberculosis cases) were resistant to 1 or more antituberculosis drugs, and nearly 10 percent (315 out of 3,313 reported tuberculosis cases) were resistant to the 2 most commonly used antituberculosis drugs, isoniazid and rifampin. The cost to treat multiple-drug-resistant tuberculosis can reach $250,000 per patient if hospitalization is required, and co-occurrence of tuberculosis with human immunodeficiency virus (HIV) and acquired immunodeficiency syndrome (AIDS) presents other health problems and costs as well. In addition, drug users are less likely to have insurance and more likely to be dependent on publicly provided health care.
Tuberculosis in the United States
Tuberculosis is primarily an airborne disease and is spread from person to person through droplets from coughing, speaking, laughing, or sneezing. Adequate ventilation is the most important measure to prevent the transmission of tuberculosis. It is estimated that between 12 and 15 million people in the United States may be infected with tuberculosis, but only 10 percent of those persons will develop active tuberculosis in their lifetime (NIAID 1993; Ellner et al. 1993). In contrast, a person dually infected with tuberculosis and HIV has a 7- to 10-percent chance per year of developing active tuberculosis.
In 1953, about 85,000 cases of tuberculosis were reported. During the next 32 years, incidence declined by an average of 6 percent per year. However, tuberculosis cases have increased each year since 1985. Between 1985 and 1991, 39,000 cases of tuberculosis occurred in excess of those expected based on previous trends. The CDC reported 26,673 cases of tuberculosis in 1992.
The populations at highest risk for developing active tuberculosis include immigrants from countries with a high incidence of active tuberculosis, drug users, the poor and homeless, persons with HIV/AIDS, and those living in inner cities and certain geographic areas.
Persons living in crowded shelters and prisons are particularly at risk for tuberculosis because of crowded conditions and poor ventilation. Others with an increased risk of being exposed to and contracting tuberculosis include injection drug users and the poor and homeless, who are likely to be more susceptible because of poor nutrition and poor health (NIAID 1993; Bloch et al. 1994). Also at risk are residents of long-term facilities, such as nursing homes. As the result of weakening immune systems, these residents often suffer recurrence of latent tuberculosis infections; the elderly are the majority of this group.
Persons with HIV/AIDS are vulnerable to reactivation of latent tuberculosis infections and are also susceptible to new tuberculosis infections. These cases usually occur in hospitals, prisons, and shelters, where HIV-infected persons constitute a growing proportion of the population. (NIAID 1993; Bloch et al. 1994; Ellner et al. 1993).
Tuberculosis is disproportionately prevalent among racial and ethnic minorities. The NIAID (1993) reported that in 1991 more than 56 percent of active tuberculosis cases were among Hispanics and African-Americans. The CDC's recent study on multiple-drug-resistant tuberculosis found that racial and ethnic minorities were 10 to 50 times more likely to develop active multiple-drug-resistant tuberculosis than non-Hispanic whites (Bloch et al. 1994).
Another key risk group comprises immigrants from countries where tuberculosis case rates are high. Many of these immigrants live in crowded housing. Because of economic and language difficulties, they have limited access to health care and may not receive treatment (NIAID 1993).
Geography is a strong risk factor, particularly for multiple-drug-resistant tuberculosis. More than three-fifths of multiple-drug-resistant tuberculosis cases nationwide have been found in New York City, and inner-city environments seem to present areas of higher risk (Bloch et al. 1994).
There is no single cause for the increase in tuberculosis cases and the emergence of multiple-drug-resistant tuberculosis as major health problems. Federal funding for tuberculosis control dramatically decreased in the 1970's, and only recently have funding levels risen to counter the increased incidence of tuberculosis. Beyond the low funding, the risk factors mentioned above constitute the primary factors associated with increased tuberculosis infection.
The major reason for the development of multiple-drug-resistant tuberculosis is noncompliance with standard regimens of tuberculosis treatment. Normal tuberculosis treatment should last 6 to 9 months and consist of two or more drugs (Iseman et al. 1993; Bloch et al. 1994). But high-risk populations, such as drug and alcohol abusers, the homeless, and persons who migrate from city to city, often quit tuberculosis treatment early. Data recently collected by the CDC indicate that only 77 percent of patients completed a recommended course of therapy in 12 months. Many multiple-drug-resistant tuberculosis cases may also develop when patients are treated with too few drugs or with inadequate doses (Bloch et al. 1994).
The Relationship Between Drug Use and Tuberculosis
The link between drug use and tuberculosis is primarily economic and social. Tuberculosis and drug use frequently occur in low-income, high-density living situations that have correspondingly poor community health, and these factors facilitate the spread of the airborne particles that transmit tuberculosis from person to person (Reichman et al. 1979).
The CDC is establishing a system for ascertaining the number of tuberculosis cases associated with drug use. Only a few studies have attempted to estimate this percentage. A study published in 1979 estimated that drug-dependent persons were two to six times more likely to contract tuberculosis than non-drug-dependent persons (Reichman et al. 1979). Using this study as a model, 600 to 1,800 cases occur per year among the roughly 5 to 6 million drug-dependent and abusing persons over what would be expected if drug abuse were not a risk factor for tuberculosis.
The link between HIV/AIDS and tuberculosis provides another way for estimating tuberculosis cases related to drug use. The CDC reports that in 1993 about 36 percent of new AIDS cases were associated with intravenous drug use (CDC 1993a). An estimate from a recent tuberculosis symposium put the number of tuberculosis patients with HIV/AIDS at 2,500 to 5,000 cases (10 to 20 percent of total tuberculosis cases per year) (Ellner et al. 1993). Multiplying 36 percent by the estimate of 2,500 to 5,000 HIV/AIDS-related tuberculosis cases yields a total range of 900 to 1,800 cases associated with intravenous drug use.
Also, a recent survey of multiple-drug-resistant tuberculosis outbreaks in four hospitals in New York City and one each in upstate New York, New Jersey, and the New York State Correctional System found that more than 90 percent of patients with multiple-drug-resistant tuberculosis have HIV infection, with case fatality rates as high as 70 to 90 percent (Bloch et al. 1994). It is probable that many of these cases could be associated with intravenous drug use.
To better capture data of this nature, the CDC in 1993 amended its tuberculosis data extraction form and tuberculosis surveillance system to require information on HIV status and injecting and noninjecting drug use for verifiable cases of tuberculosis. For now, an estimated 1,200 annual tuberculosis cases are associated with drug abuse. The estimate appears to be relatively conservative, but it is within the plausible range suggested by the limited evidence in hand.
Costs of Treating Tuberculosis
The standard length of treatment for tuberculosis is 6 to 9 months and involves taking drugs daily or two or three times weekly (Iseman et al. 1993). Treatment occurs in one of two ways for most tuberculosis patients: self-administered treatment, in which the patient is responsible for taking drugs, or directly observed treatment, in which the patient must take medication in the presence of medical staff. Directly observed treatment is the preferred method because it allows tracking of the patient's record for taking medication. Hospitalization of tuberculosis patients is usually reserved for persons who are noncompliant with their treatment, particularly if they have multiple-drug-resistant tuberculosis. Adherence to a prescribed treatment regimen is important, and failure to complete a standard course of therapy promotes the emergence of drug-resistant strains of tuberculosis.
Treatment length for persons with multiple-drug-resistant tuberculosis can last 12 to 24 months, and completion of this treatment is difficult to monitor because of its length and the population being treated (Ellner et al. 1993; Mahmoudi and Iseman 1993). Many multiple-drug-resistant tuberculosis patients stop taking medication after a few weeks because they feel better or because the drugs have unpleasant side effects (NIAID 1993).
The CDC is currently performing a detailed study of the hospitalization costs related to tuberculosis, and the results will be available later in 1994. However, in an unpublished study, the CDC estimated that in 1991 about $617 million was spent on the treatment of tuberculosis, of which $182 million was for outpatient costs and $435 million was for inpatient costs (CDC 1994b, personal communication). These estimates include medication costs associated with tuberculosis treatment. This amounted to about $23,000 per reported case in 1991.
However, the costs to treat multiple-drug-resistant tuberculosis can be as high as $250,000 per patient (Iseman et al. 1993). Costs are quite high because it is often necessary to hospitalize multiple-drug-resistant tuberculosis patients for extensive periods of time, and the total course of treatment (inpatient plus outpatient) can require up to 24 months.
Several variables affect the course and treatment of multiple-drug-resistant tuberculosis. One important variable is making the correct diagnosis. A recent study of 35 multiple-drug-resistant tuberculosis patients who were identified and treated in 1989 and 1990 found that 28 had received an improper diagnosis or management error during treatment (Mahmoudi and Iseman 1993). The most common errors were adding one drug to a failing regimen, failure to detect drug resistance, and failure to deal with noncompliance with prescribed treatment. As a result of these errors, the 28 patients had an average of 129 days of hospitalization, 63 percent of the patients required surgery, and each patient received an average of 4.8 medications. The errors in diagnosis resulted in $4.8 million in hospitalization costs, which at the time of the study constituted more than one-half of the CDC's tuberculosis elimination budget ($9.1 million in 1990). Also, the drugs to which multiple-drug-resistant tuberculosis patients are resistant are important factors in arriving at treatment costs. Resistance to drugs commonly used in tuberculosis treatment, such as isoniazid and rifampin, can increase treatment length to 18 to 24 months, with the potential for cure decreasing (Ellner et al. 1993).
Tuberculosis is also difficult to diagnose in immune-compromised individuals. Persons with HIV/AIDS may lack the immune response to make the standard tuberculosis skin test reliable (Ellner et al. 1993; NIAID 1993). These persons are referred to as anergic, and additional skin-test control antigens should be used to screen them.
Federal funding for research into tuberculosis control and elimination has risen steadily in the past few years (see figure 4.2 below). Both the CDC and NIAID are conducting research on tuberculosis. Funding in 1994 for the CDC and its Tuberculosis Elimination Division was $142 million, a threefold increase from its 1992 budget of $46 million and a tenfold increase over the $14 million budget for tuberculosis in 1988.
CDC funding primarily occurs in the form of grants, which support activities including directly observed treatment, outreach and screening, and followup of tuberculosis cases. Beginning in 1988, part of the CDC tuberculosis budget was allocated to study both HIV and tuberculosis, and this money has been used to develop registry matching among persons with HIV/AIDS and tuberculosis to provide State and city health departments with resources for conducting screening and preventive therapy at drug treatment centers and correctional facilities and for research on preventive therapy and treatment regimens.
Starting in 1992, CDC-funded activities related to multiple-drug-resistant tuberculosis included strengthening State laboratories, increasing surveillance programs to detect multiple-drug-resistant tuberculosis, and increasing screening among high-risk groups. NIAID, the primary institute for tuberculosis research at the National Institutes of Health, had its funding increased nearly sixfold from 1991 to 1993, with $21 million allocated in fiscal year 1993 and $28 million slated for fiscal year 1994. NIAID has recently formulated a comprehensive research agenda to expand its efforts to eliminate tuberculosis.
Conclusion
Total health treatment costs for tuberculosis and expenditures for drug-related cases are summarized in table 4.16. Based on the most current data available (primarily from CDC), total expenditures were $667 million in 1991. Hospital inpatient costs accounted for about two-thirds of this total, outpatient treatment cost another $182 million, and public health and research activities of the CDC and NIAID were $50 million. The estimate of total expenditures may be a modest overestimate because it is likely that some fraction of CDC funding was to deliver tuberculosis treatment. CDC staff were not able to break out this estimate for the purposes of this study.
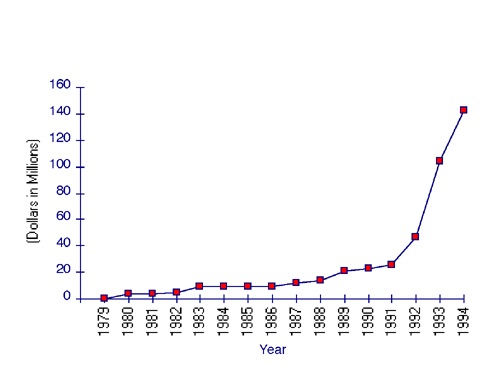 Figure 4.2 CDC Annual Expenditures for Tuberculosis Elimination, 1979-1994 Source: Centers for Disease Control and Prevention (1994b).
The few studies available suggest that drug abuse is associated with about 2 to 7 percent of tuberculosis cases in the United States. A midpoint estimate of 4.5 percent is used here. Application of this figure to estimated expenditures on tuberculosis shows that about $30 million was spent on drug abuse-related tuberculosis treatment, control, and research in 1991.
These estimates are probably conservative for several reasons. First, public health and research spending on tuberculosis has accelerated dramatically since 1991 (from $50 million to $170 million). Second, the incidence of tuberculosis has increased somewhat since 1991. More important, the incidence/prevalence of multiple-drug-resistant tuberculosis is also believed to be increasing, and it can cost much more to treat than non-drug-resistant tuberculosis.
The most critical component of these estimates is the proportion of tuberculosis cases that are related to drug abuse. There have been very few studies on this issue, but there have been sufficient indications that CDC has recently modified its tuberculosis reporting forms to inquire whether drug abuse is a risk behavior exhibited by a reported case.
- Table 4.12: Categories of Health Care Services Necessitated by Fetal Alcohol Syndrome
-
Table 4.12: Categories of Health Care Services Necessitated by Fetal Alcohol Syndrome Period During Which Care Was Required Types of Care Required Immediate neonatal care
Neonatal intensive care
Hospital evaluationIntermediate care (ranging from early to late childhood)
Heart defects and surgery
Cleft palate correction and speech therapy
Neurotube treatment
Audiological evaluation and surgeryLong-term direct treatment
Institutional services for child through adult life for FAS victims with mental retardation
Day services for adult FAS victims with mental retardationOther long-term direct costs
Special education for minimal and moderate degrees of mental retardation
Training
Rehabilitative programs
- Table 4.13: Health and Other Services for Fetal Alcohol Syndrome, 1992
-
Table 4.13: Health and Other Services for Fetal Alcohol Syndrome, 1992 Specific Birth Defect Annual Cost of Treatment Length of Treatment Period Percent in FAS Population Served Total Cost (millions) Prenatal growth retardation Neonatal intensive care: 7 days at $2,000/day Once, first year 80.0% 6,365 $89.1 Postnatal growth retardation Hospital evaluation, $2,357 Once, first year 80.0% 6,365 $15.0 Audiological defects Neonatal screening, $97 Once, first year 100.0% 7,956 $0.8 AVR test, $263 Once, first year 56.0% 4,455 $1.2 Acoustic impedance test, $51 Once, first year 56.0% 4,455 $0.2 Serous otitis media Surgery, $1,315, incl. recovery Once, first year 81.0% 6,444 $8.5 Midsensorineural hearing loss Hearing aid evaluation, $124 Once by 12 yrs. 27.0% 2,205 $0.3 Hearing aids, $750 Once by 12 yrs. 27.0% 2,205 $1.7 Hearing aid check, $230 Once by 12 yrs. 27.0% 2,205 $0.5 Hearing aid orientation, $81 Once by 12 yrs. 27.0% 2,205 $0.2 Minimal brain dysfunction Special education: one teacher plus one 7-hour educational assistance per 10 students at $5,650/year Ages 5—18 53.0% 52,955 $299.2 Mid-moderate mental retardation Special education: one teacher plus one 7-hour and one 4-hour educational assistance per 7.5 students at $7,790/year Ages 5—21 18.0% 20,661 $161.0 Home care, $32,850/year Ages 22—65 14.4% 20,751 $681.7 Residential care, $36,500/year Ages 22—65 3.6% 5,188 $189.4 Severe mental retardation Residential care, $36,500/ year Ages 5—65 5.0% 12,945 $472.5 Cleft palate Series of operations plus followup for hearing and speech, $20,000 Once by 15 yrs. 12.5% 990 $19.8 Speech therapy at $35/session, weekly One year between ages 5 and 15 12.5% 997 $1.8 Neurotube Surgery, at $10,312 Once by 10 yrs. 1.8% 150 $1.5 TOTAL $1,944.2 Sources: Previous studies of the costs of treating FAS: Russell (1980); Harwood and Napolitano (1985); Rice et al. (1990); Abel and Sokol (1987, 1991a,b). Population data: U.S. Bureau of the Census (1994).
Notes: Components may not sum to totals because of rounding. Cost does not account for mandatory Federal early intervention programs for alcohol- and drug-exposed infants and toddlers, ages 2 to 4. Prevalence in FAS population is the proportion who need services. Somewhat fewer persons actually receive needed services, although there are no data available at present to estimate the proportion of care delivered versus needed.
- Table 4.14: Overview of Selected Studies of Drug-Exposed Infants
-
Table 4.14: Overview of Selected Studies of Drug-Exposed Infants Authors, Publication Date Population Studied Study Methodology and Population Major Findings Joyce et al. (1994) Hospital Application of prevalence rates from a California State study to national birth figures was used to estimate national prevalence for 1991; the hospital-based prevalence data used information on all patients who delivered at large New York City hospitals during a 5-month period. 287,800 black, white, and Hispanic infants were born exposed to illegal drugs in 1991
11.2% of the hospital sample were exposed to one or more drugsZuckerman et al. (1989);
Frank et al. (1988)Hospital Assessed cocaine and marijuana use by interviews and urine tests obtained prenatally and immediately post partum from 679 women enrolled in prenatal care at Boston City Hospital between 1984 and 1987. 18.0% cocaine
27.0% marijuana
4.0% opiatesMacGregor et al. (1990) Hospital Urine tests for marijuana prevalence among 322 women delivering in an urban hospital admitted during a 1.5-month period in 1987. 19.9% marijuana
32.3% public prenatal care patients
7.5% private prenatal care patientsChasnoff et al. (1990) Population Urine tests of all pregnant women enrolled for prenatal care during a 1-month period in 1989 at any of 5 public clinics and at any of 12 private obstetrical practices in Pinellas County, Florida. 3.4% cocaine
11.9% marijuana
0.3% opiatesGomby and Shiono (1991) Population (national survey) Used the 1990 NIDA National Household Survey on Drug Abuse (NHSDA) and 1987 national birth rates to estimate prevalence of alcohol, tobacco, and other drug use among pregnant women (ages 12-34). 4.5% cocaine
17.4% marijuanaGerstein and Harwood (1990) Population (national survey) Used the 1988 NIDA NHSDA to determine (1) the numbers of infants exposed each year to one or more illicit drugs and (2) the number of pregnant women in need of treatment. 350,000 to 625 infants are exposed each year to 1 or more illicit drugs
105,000 pregnant women are in need of drug treatmentSource: CSAP (1994).
- Table 4.15: Effects of Specific Drugs on Infant Health, Growth, and Development
-
Table 4.15: Effects of Specific Drugs on Infant Health, Growth, and Development Drug Effects on Health and Growth Effects on Development and Behavior Marijuana Risk for reduced birth weight and reduced birth length. Some evidence of lower performance in the areas of motor ability, memory, and verbal ability, but firm conclusions are lacking. Opiates Risk for low birth weight for gestational age; smaller head circumference; neonatal abstinence syndrome (NAS), whose signs include diarrhea, fever, sneezing, yawning, tremors, seizures, irregular breathing, and irritability. Risk for high levels of arousal and irritability, tremulousness, and motor behavior up to 1 month after birth, but the statistical differences between exposed and nonexposed infants in terms of behavior and development tend to be small. Cocaine Increased risk for miscarriage or stillbirth; increased risk for premature delivery; reduced birth length; reduced head size; reduced weight; statistically significant increased risk for congenital malformations. Risk for delays in motor growth on muscle tone, primitive reflexes, and volitional movement; irritability; potential for altered nerve cell organization and interaction.
- Table 4.16: Financial Resources Expended on Tuberculosis Treatment and Elimination, 1991
-
Table 4.16: Financial Resources Expended on Tuberculosis Treatment and Elimination, 1991 (millions of dollars) Type of Expenditure Total Drug Related Treatment costs Outpatient $182.0 $8.2 Inpatient $435.0 $19.6 Public health/research CDC $46.5 $2.1 NIAID $3.5 $0.2 Total expenditures $667.0 $30.2 Note: Components may not sum to totals because of rounding. Treatment costs probably include funds from CDC, but no breakdown is available.