The cost of alcohol abuse-caused illness treated in hospitals in 1992 is estimated to be about $5.9 billion. Costs for hospital treatment of drug abuse-caused illness are estimated at only $572 million because of a lack of data to attribute specific health consequences to drug abuse.
Hospital Costs
Introduction
Alcohol and drug abuse problems have been targeted as an important and growing source of hospital-based medical care and expenditures. There are primarily three ways in which alcohol and drug abuse are seen in hospitals:
- Direct and specific consequences of alcohol or drug abuse, such as psychoses, withdrawal, or poisoning, may necessitate hospitalization.
- Alcohol or drug abuse may contribute to other illnesses or injuries that require treatment.
- Alcohol or drug abuse may complicate treatment of other illnesses or injuries, perhaps resulting in longer lengths of stay in the hospital.
Each of these results in distinctly different costs. To the degree that data are available for each, each is counted in this study.
This report relies on the two estimation methodologies employed in the prior studies of the impact of alcohol and drug abuse on hospital care. The first approach is termed the diagnosed population (DP) approach used by Rice et al. (1990), and the second is the illness-specific (IS) approach used in the two previous Research Triangle Institute studies (Cruze et al. 1981; Harwood et al. 1984). Both approaches count hospitalization days that result directly and specifically from alcohol and drug abuse - that is, they count all days for which the primary diagnosis was an alcohol or drug abuse-specific diagnosis (e.g., psychosis, withdrawal, and poisoning). Where the two approaches differ is in their estimation of indirect hospital days attributable to alcohol and drug abuse.
- Diagnosed-Population Approach. The diagnosed population (DP) approach suggests that alcohol and drug abuse problems complicate treatment for certain conditions, resulting in longer lengths of stay for persons with a secondary alcohol or drug abuse disorder than for persons with no secondary alcohol or drug abuse disorder.
- Illness-Specific Approach. The illness-specific (IS) approach is predicated on the evidence that certain health conditions (e.g., forms of cirrhosis) are caused by alcohol and drug abuse, and accordingly, some proportion of the total hospitalizations for conditions that are partially caused by alcohol and drug abuse ought to be attributed to alcohol and drug abuse problems.
Both approaches offer insights and have limitations regarding alcohol and drug abuse-related hospitalizations. The IS approach relies on prior research that has established a causal link between alcohol or drug abuse and illnesses and injuries. To date, the most extensive research available estimates the percentage of mortalities attributable to alcohol by diagnostic category (Stinson et al. 1993). For example, 75 percent of mortalities from malignant neoplasms of the esophagus are attributable to alcohol abuse. Applying the mortality data to morbidity allows us to allocate a share of all health expenditures for each relevant diagnostic category. By inference then, 75 percent of hospitalizations for malignant neoplasms of the esophagus also may be allocated to alcohol abuse. Using mortality-based attribution factors to estimate the extent of morbidity attributable to alcohol consumption generates a conservative bias. This approach will systematically exclude any nonfatal conditions caused by alcohol and will tend to understate the incidence of alcohol-caused conditions that are not always fatal. An additional source of conservative bias associated with the IS approach is that it is limited to the causal research available - the role of alcohol in mortality has been well studied, but the role of drug abuse has not.
The DP approach includes all diagnostic categories and is not constrained by availability of estimates concerning the degree to which alcohol and drug abuse causes other health problems. However, several health conditions have been found to be at least partially caused by alcohol and drug abuse, such that a fraction of all treatment days for those conditions can be attributed to alcohol and drug abuse. The DP approach only calculates the additional days associated with a co-occurring alcohol or drug abuse disorder.
The results of the DP approach are largely complementary to the IS approach, however, and this report combines both approaches in the final estimate of costs. Figure 4.1 (below) demonstrates this logic in graphic form. The vertical axis shows length of stay; the horizontal axis shows the number of discharges. The first two columns, treatment for alcohol and drug problems and illnesses specifically caused by alcohol or drug abuse, are fully counted in the IS and DP approaches and are counted in this report (accounting for a little more than 0.5 million discharges). The third column includes disorders partially caused by alcohol or drug abuse (again, about 0.5 million discharges), for which the IS approach counts the proportion of discharges and days (slashes on the left side of the column). Under the DP approach, additional days are calculated for all discharges where alcohol or drug abuse is listed as a secondary diagnosis. This includes more than 2 million discharges, of which 0.5 million are the same as those used in the IS approach. The final column, on the right, represents another 32 million discharges in 1992, none of whom were hospitalized for conditions related to alcohol or drug abuse.
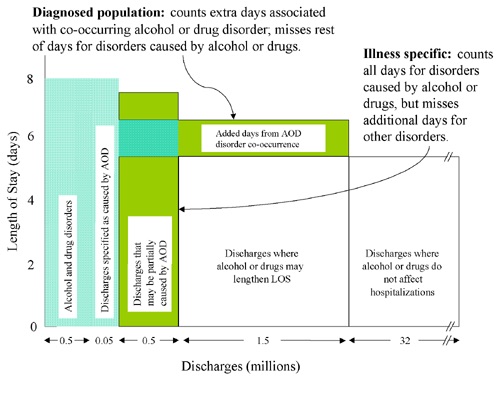 Figure 4.1 Graphic Depiction of Illness-Specific and Diagnosed-Population Approaches. (AOD = alcohol or drug, LOS = length of stay) Note: All shaded areas are estimated in this study.
Analysis of Hospital Days Under Alternative Approaches
Analyses were conducted using the National Center for Health Statistics' 1990, 1991, and 1992 National Hospital Discharge Survey (NHDS), including data for newborns. The NHDS reports the number of inpatients discharged and days of care for short-stay, non-Federal hospitals by primary and secondary diagnosis as catalogued in the International Classification of Diseases (ICD). A complete list of the ICD version 9 (ICD-9) codes is included in Appendix A.
Hospital-Based Alcohol and Drug Abuse Treatment
Both the DP and IS approaches estimate the number of days of alcohol and/or drug abuse-specific treatment provided in hospital settings. It is estimated that in 1992, there were more than 524,000 discharges where the treatment provided was primarily for an alcohol or drug abuse diagnosis (see table 4.6). Almost 4.2 million days of care were delivered, of which 65 percent were for alcohol and 35 percent were for drug abuse diagnoses. An episode of hospital-based treatment averaged 8.4 days for primary alcohol diagnoses and 7.3 days for primary drug abuse diagnoses. Most of these hospital treatment episodes were probably short-term detoxification episodes, and a single alcohol or drug abuser could have had more than one, and possibly many, such episodes. The costs for hospital-based care were estimated separately by Harwood et al. (1994) and are discussed in section 4.1.
Treatment for Conditions Specifically Caused by Alcohol or Drug Abuse
Some illnesses are definitionally and specifically caused by alcohol or drug abuse (e.g., alcoholic cardiomyopathy), where the role of alcohol or drugs was defined by the diagnosticians at the time that a patient was treated. For these cases, all admissions and discharges are allocated to either alcohol or drug abuse as appropriate. It is estimated that there were about 50,000 discharges in 1992 for illnesses that are specifically caused by alcohol abuse, resulting in about 410,000 days of care. It is also estimated that there were fewer than 1,000 discharges for drug abuse disorders, resulting in about 6,000 days of care. These estimates are unreliable, however, because of the small cell sizes in the survey.
Medical treatment for fetal alcohol syndrome and other effects of drug exposure on the fetus or newborn are discussed in depth under special disease groups later in this chapter. As a result, values from table 4.7 for these diagnoses are not included in the total hospital costs associated with alcohol or drug abuse.
Additional Hospital Days Using Diagnosed-Population Approach
The number of additional hospital days that result from co-occurring alcohol and drug abuse disorders was calculated by comparing lengths of stay and applying the additional length of stay to the number of discharges found among persons with a co-occurring alcohol or drug abuse disorder. To accomplish this, we first excluded discharges for primary diagnoses of alcohol or drug abuse disorders (see the previous section for a discussion of treatment for alcohol or drug abuse problems in the hospital). Second, we segmented the remaining discharges into four groups: (1) patients who had no co-occurring alcohol or drug abuse disorder, (2) patients who had an alcohol but no drug disorder, (3) patients who had a drug but no alcohol disorder, and (4) patients who had both an alcohol and drug disorder.
The lengths of stay for persons with no alcohol or drug disorder diagnosis were subtracted from the lengths of stay for persons with alcohol, drug, or combined alcohol and drug disorders listed as a secondary diagnosis. The result of the subtraction is the estimated additional days per episode resulting from a co-occurring alcohol or drug disorder. The additional days per episode were then multiplied by the number of discharges for each group with a co-occurring alcohol or drug disorder to obtain total additional days of care.
Table 4.8 shows the number of patient discharges, days of care, and average length of stays, distributed by major diagnostic categories, for the four groups previously discussed. The vast majority of discharges (94.1 percent) did not have any secondary alcohol or drug abuse diagnosis, and 92.1 percent of the total days of care were delivered to persons with no secondary alcohol or drug abuse diagnosis. Out of 34.4 million discharges from hospitals, 2.0 million had a secondary (but no primary) diagnosis of alcohol and drug abuse. Of those, 1.1 million had a secondary alcohol abuse diagnosis, 770,000 had a secondary drug abuse diagnosis, and 140,000 had secondary diagnoses of both alcohol and drug abuse. Rice et al.'s (1990) previous estimations of hospital-related stays included mental illness (and alcohol and drug abuse) as a category for analysis of psychiatric and alcohol and drug abuse comorbidity. The present report analyzes costs from psychiatric comorbidity separately below, and this category is not included in the table.
As expected, lengths of stay were longer for patients with co-occurring alcohol and drug problems (7.7 days) compared with stays for other patients (5.6 days). In some disease categories, lengths of stay with a recorded co-occurring alcohol and drug abuse disorder were twice as long as those among noncomorbid patients. However, there were two categories for which length of stay was not longer among comorbid patients. First, lengths of stay for endocrine, nutritional, and metabolic disorders were slightly lower among comorbid than among noncomorbid patients. Second, lengths of stay for patients with injuries and poisoning were lower among comorbid patients than among noncomorbid patients. Additional research should examine whether injuries and poisonings among persons with an alcohol or drug abuse comorbidity are more serious and more likely to result in death, which would explain the shorter lengths of stay. Finally, comorbid patients with digestive problems accounted for more additional days of care (628,000) than any other category.
Because of the extremely large sample sizes, it is expected - but not established - that the substantial differences in length of stay between populations are statistically significant. Future assessments of the additional days of hospital care resulting from co-occurring alcohol and drug abuse disorders would benefit from a more comprehensive analysis that includes other factors that could explain variation in length of stay. For example, age, sex, and sociodemographic status may covary with alcohol and drug abuse and explain part of the additional length of stay observed here (e.g., see Bradley and Zarkin 1996).
Alcohol and Drug Abuse-Specific Hospital Episodes Using the Illness-Specific Approach
As discussed above, considerable research evidence has accumulated concerning the unique contribution of alcohol to illnesses and injuries that result in death (Stinson et al. 1993). For other conditions (e.g., cirrhosis), a proportion of the cases are caused by alcohol abuse. Research evidence is available regarding the proportion of mortalities related to alcohol consumption. It is assumed here that for any given illness or injury partially caused by alcohol, the proportion of hospitalizations caused by alcohol is equal to the proportion of deaths from that diagnosis that is caused by alcohol. This assumption will tend to understate the role of alcohol in causing hospitalizations because the data on the role of alcohol in mortality from various causes do not reflect alcohol's role in causing nonfatal conditions and understate the role of alcohol in causing diseases that are not always the ultimate cause of death. Despite this bias, the IS approach is the best available technique for estimating the role of alcohol in causing various illnesses and injuries. Unfortunately, similar evidence is not available for a variety of drug abuse-caused illnesses. Table 4.9 shows the number of discharges related to alcohol and drug abuse calculated using the IS approach.
Using the IS approach, it is estimated that more than 511,000 hospital discharges in 1992 were for illnesses or injuries caused by alcohol abuse, for a total of just under 4.0 million days of hospital care. Some conditions that are caused in part by alcohol use (e.g., 75 percent of malignant neoplasms of the esophagus) nonetheless had relatively few discharges. On the other hand, whereas only 10 percent of fractures were estimated to have been caused by alcohol use, the fact that there were many hospitalizations for fractures means that fractures accounted for almost 20 percent of the alcohol-related discharges and 20 percent of alcohol-related days of care.
Discussion of the Differences Between Diagnosed-Population and Illness-Specific Approaches
Both the DP and IS approaches include the days of care for the treatment of alcohol and drug abuse disorders as well as disorders that are specifically and directly caused by alcohol and drug abuse. In all, this represents 3.1 million days of care for alcohol abuse and about 1.5 million days of care for drug abuse.
Where the IS and DP approaches differ, however, is in their respective assumptions about the contribution of alcohol or drug abuse to other illnesses and injuries treated in hospitals. The DP approach calculates that about 2.3 million additional days of care were brought about as a result of the co-occurrence of alcohol or drug disorders. The IS approach calculates that about 4.0 million days of care were brought about for the treatment of disorders that are partially caused by alcohol abuse (similar causal factors are not available for drug abuse).
Both approaches have substantial advantages and disadvantages. The IS approach relies on a rigorously conducted and reviewed body of research to determine the days of care attributed to alcohol abuse. All of the costs of care for patients whose diseases have been caused by alcohol or drug abuse are counted with the IS approach, whereas only the additional days of care associated with co-occurring alcohol and drug abuse disorders are counted with the DP approach. The DP approach therefore stands to underrepresent the cost of alcohol and drug abuse-induced illness by a wider margin than does the IS approach. However, there are methodological and other limits associated with applying "cause" as required by the IS approach (see discussion in chapter 3). Moreover, similar data on the causal role of drug abuse in morbidity are not yet available.
The DP approach does capture the full array of diagnostic categories, not just those for which specific research on alcohol and drug abuse causality has been reported. Additionally, the fundamental argument that alcohol and drug abuse complicates treatment of other conditions is compelling. The DP approach ought to be extended with multivariate analyses, which would allow for modeling of additional days caused by alcohol or drug abuse, holding constant the effects of other factors such as age, gender, and income. However, the DP approach relies heavily on care providers to accurately document secondary alcohol or drug abuse conditions. Moreover, the DP approach misses cases where alcohol or drug abuse was a cause but for which alcohol or drug abuse would never be diagnosed - such as an individual who does not abuse alcohol but who is injured in an alcohol-related crash.
Estimating Costs
The DP and IS approaches are not mutually exclusive and, in fact, are complementary. By removing the diagnoses that are caused by alcohol abuse and drug abuse from the DP approach, the resulting additional days can be directly added to the illness-specific days. The result is an estimated total of 10 million days of care provided in hospitals as a consequence of alcohol and/or drug abuse (see table 4.10). Of those days, about 5.3 million days are for the treatment of illnesses resulting from alcohol problems or for longer lengths of stay associated with co-occurring alcohol disorders. Approximately 0.5 million (512,000) days of care are associated with longer lengths of stay brought about by a co-occurring drug disorder, plus a small number of days attributed to drug-caused illnesses.
The average cost per day of hospital care in 1992 was estimated to be $1,012 for care provided in short-term, non-Federal hospitals. This includes the costs incurred by the hospital and by independent physicians. The hospital per diem, $816, is based on reported expenditures among American Hospital Association members for 1992 (American Hospital Association 1993). The cost per inpatient day for outside physician services is estimated to be $196 and is derived by dividing total physician office receipts for inpatient care by the total inpatient hospital days in the United States in 1992. Applying the average cost per day to the number of hospital days associated with alcohol or drug abuse results in an estimated $5.3 billion for alcohol problems and $518 million for drug abuse problems.
Veterans Affairs and Other Federal Hospitals
No data are available concerning treatment provided in Veterans Affairs and other Federal hospitals of the medical consequences of alcohol and drug abuse. It is therefore assumed that the relative proportion of costs incurred as a result of treating the health consequences of alcohol or drug abuse in non-Federal hospitals also applies to Veterans Affairs and other Federal hospitals. Veterans Affairs and other Federal hospital revenues compose 9.5 percent of total hospital revenues in the United States (Levit et al. 1996). Using this, we can estimate the amount spent in hospitals by multiplying the non-Federal hospital costs attributed to alcohol and drug abuse (5,777 days at $816 per day) by the appropriate factor. The result is an estimated cost of $495 in Federal, short-stay hospital costs, of which $451 million and $44 million are allocated to alcohol and drug abuse, respectively. Further research into the impact of alcohol on the Veterans Affairs and other Federal hospital systems is needed: It is altogether possible that there is a higher incidence of alcohol- and drug-related illness and injury seen in settings that treat veterans compared with the incidence in general acute care settings.
Outpatient Medical Care
Outpatient medical care for alcohol abuse-specific and alcohol abuse-related conditions cost approximately $1.75 billion during 1992.
Alcohol and drug abusers seek help from outpatient medical care providers for alcohol and drug abuse-specific and alcohol and drug abuse-related disorders. To estimate this, the IS approach used in the previous section was also applied to data on outpatient medical care utilization from the annual National Ambulatory Medical Care Survey. The DP approach that was also discussed in the previous section is not appropriate for this data source: NAMCS is, in effect, a survey of outpatient visits that are not longitudinally connected. It is impossible to determine whether persons with a comorbid alcohol and drug abuse problem use more or less outpatient services than persons with no comorbidity. Data for 1990 were analyzed, and the same causal factors employed in the hospital analysis above were used here. The findings are shown in table 4.11. Alcohol and drug abuse treatment service visits are shown, but their cost is included as part of the discussion on specialty alcohol and drug abuse treatment in section 4.2.
It is estimated that about 10.5 million visits were made to outpatient medical care providers for alcohol and drug abuse-specific or alcohol and drug abuse-caused problems, other than primary treatment for the alcohol and drug abuse itself. These visits were for alcohol-specific and alcohol-related disorders only. There were no ambulatory care visits in the data source for drug abuse-specific disorders (that is, disorders definitionally attributable to drug abuse). In addition, as noted earlier, there are no causal data with which to estimate drug abuse-caused disorders. Two-thirds of the outpatient medical services were provided by general practitioners, including family doctors and pediatricians, and about one-third were provided by "other" physicians, including specialists. We estimate the cost per physician visit to have been $166 in 1992. Altogether, the 10.5 million outpatient visits for consequences attributed to alcohol and drug abuse cost about $1.7 billion.
Nursing Homes
This study estimates that $623 million in nursing home costs can be attributed to alcohol abuse. Total nursing home expenditures in 1992 were $62.3 billion (NCHS 1995). Rice et al. (1990) attributed 2 percent of costs in 1985 to alcohol problems and none to drug abuse problems. Harwood et al. (1984) attributed 0.8 percent to alcohol and none to drugs. Rice's attribution factor included cases in which alcohol was a secondary as well as primary diagnosis. However, alcohol may not be the main factor underlying placement in nursing homes. The 1985 National Nursing Home Survey (NNHS) determined that 3.9 percent of nursing home residents have an alcohol or drug abuse problem (NCHS 1989, table A). Further analysis of NNHS suggests that 26 percent of the residents with an alcohol or drug abuse problem may in fact have a primary diagnosis of alcohol or drug abuse, which is 1.0 percent of the entire nursing home population. Applying this estimate of 1.0 percent to the total national expenditures on nursing homes yields $623 million for alcohol and drug abuse combined. All of this is allocated to alcohol abuse.
Pharmaceuticals
National expenditures on drugs and medical nondurables were $71.2 billion in 1992 (Levit et al. 1996). This study assumes that the proportion of these expenditures that went for conditions related to or caused by alcohol abuse is comparable to the proportion of inpatient hospital days for illnesses that are caused in whole or in part by alcohol abuse. This is the approach used in the studies by Cruze et al. (1981) and Harwood et al. (1984). Accordingly, 2.2 percent of the total national expenditure on drugs and medical nondurables, or about $1.57 billion, is allocated to alcohol abuse. Again, there is no equivalent basis for ascertaining a similar proportion for drug abuse; instead, pharmaceutical costs due to drug abuse are included in the discussion of specific diseases in this chapter.
Other Health Professionals
Total expenditures for other health professionals in the United States - such as dentists, midwives, and home health technicians - were $42.1 billion in 1992 (NCHS 1995). It is again assumed that 2.2 percent of this total, or $0.9 billion, was attributable to the medical consequences of alcohol. This may be a slight overestimate of the cost attributable to other health professionals, because some of the other health professionals include psychologists and social workers, whose costs have been estimated separately under the category for specialty alcohol and drug abuse treatment providers. However, psychologists and social workers represent only about $4.0 billion out of the $42.1 billion in expenditures for other health professionals (Harwood et al. 1994). Costs due to drug abuse are included in the discussion of specific diseases presented in this chapter.
- Table 4.6: Hospital Episodes Primarily for Alcohol or Drug Abuse Disorders, 1992
-
Table 4.6: Hospital Episodes Primarily for Alcohol or Drug Abuse Disorders, 1992 Alcohol and Drug Abuse Disorders Requiring Hospitalization ICD-9 Code Discharges Days Average LOS* in days Primary Alcohol Episodes Alcohol psychoses 291 47,895 290,831 6.07 Alcohol dependence 303 241,645 2,314,599 9.58 Nondependent abuse of alcohol 305.0 26,885 91,847 3.42 Toxic effects of ethyl alcohol 980.0 4,388 10,129 2.31 Total, Alcohol Abuse 320,813 2,707,406 8.44 Primary Drug Abuse Episodes Drug psychoses 292.0 14,679 118,599 8.08 Drug dependence 304.0 92,850 986,364 10.62 Nondependent abuse of drugs 305.2
305.920,439 146,256 7.16 Poisoning by opiates and related narcotics 965.0 5,233 20,506 3.92 Poisoning by sedatives and hypnotics 967 7,452 22,335 3.00 Poisoning by central nervous system muscle tone depressants 968 2,102 3,639 1.73 Poisoning by psychotropic agents 969 57,893 171,300 2.96 Poisoning by central nervous system stimulants 970 2,968 10,176 3.43 Total, Drug Abuse 203,616 1,479,175 7.26 Total 524,429 4,186,581 7.98 Source: Analysis by The Lewin Group.
Note: Components may not sum to totals because of rounding.
*LOS = length of stay.
- Table 4.7: Hospital Episodes for Disorders Specifically Caused by Alcohol and Drug Abuse
-
Table 4.7: Hospital Episodes for Disorders Specifically Caused by Alcohol and Drug Abuse Disorders Specifically Caused by Alcohol and Drug Abuse ICD-9 Code Discharges Days Average LOS* in days Alcohol Specific Alcoholic polyneuropathy 357.5 0.2 3.2 13.4 Alcoholic cardiomyopathy 425.5 2.4 17.8 7.3 Alcoholic gastritis 535.3 9.4 34.7 3.7 Alcoholic cirrhosis 571.0 - 571.3 38.2 353.0 9.2 Fetal alcohol syndrome (FAS) 760.71 0.1 0.7 9.7 Total, Alcohol Specific 50.3 409.5 8.1 Total, Alcohol Specific (without FAS ) 50.2 408.8 8.1 Drug Specific Polyneuropathy due to drugs 357.6 0.3 1.0 3.4 Narcotics affecting fetus or newborn via placenta or breast 760.72 0.1 0.5 3.4 Hallucinogens affecting fetus or newborn via placenta or breast 760.73 0.2 3.8 21.0 Drug withdrawal syndrome in newborns 779.5 0.1 1.0 6.9 Total, Drug Abuse Specific 0.7 6.3 9.0 Total, Drug Abuse Specific (not including effects on newborn/fetus) 0.3 1.0 3.4 Note: Components may not sum to totals because of rounding.
-
Table 4.8: Alcohol and Drug Abuse-Related Additional Days of Hospital Care, 1992 Diagnostic Category No Alcohol or Drug Abuse Comorbidity Alcohol Abuse Comorbidity Disch. (000's) Days (000's) LOS* Disch. (000's) Days (000's) LOS* Add. Days (000's) Infect./Parasit. 676 5,953 8.8 23 266 11.8 67 Neoplasm 1,775 15,070 8.5 37 490 13.3 176 Endoc./Nutrit. 1,072 7,371 6.9 88 575 6.5 (32) Blood 297 1,817 6.1 16 125 8.0 30 Nervous 647 3,652 5.6 28 284 10.1 125 Circulatory 5,069 36,999 7.3 209 1,622 7.8 95 Respiratory 2,706 18,859 7.0 111 979 8.8 205 Digestive 2,821 16,825 6.0 268 2,120 7.9 523 Genitourinary 1,818 9,244 5.1 29 194 6.7 47 Pregnancy 4,606 12,317 2.7 8 70 8.8 48 Skin 391 3,354 8.6 21 213 10.2 33 Musc./Skel. 1,485 9,566 6.4 22 202 9.0 57 Injury/Poison 2,361 16,539 7.0 243 1,666 6.9 (35) Supplemental 4,188 15,039 3.6 11 130 11.4 89 Other 2,469 10,007 4.1 1 11 18.7 7 Total 32,380 182,612 5.6 1,114 8,945 8.0 1,434.9 Diagnostic Category Drug Abuse Comorbidity Both Alcohol and Drug Abuse Comorbidity Disch. (000's) Days (000's) LOS* Add. Days (000's) Disch. (000's) Days (000's) LOS* Add. Days (000's) Infect./Parasit. 39 621 15.9 278 6 103 17.0 50 Neoplasm 23 233 10.0 36 2 15 7.7 (2) Endoc./Nutrit. 31 198 6.3 (17) 6 35 6.2 (4) Blood 10 64 6.2 1 1 8 8.7 3 Nervous 29 184 6.3 20 10 64 6.5 8 Circulatory 92 788 8.6 119 19 166 8.7 27 Respiratory 81 760 9.4 194 15 107 7.4 6 Digestive 49 345 7.1 56 19 159 8.6 49 Genitourinary 28 192 6.9 51 2 18 8.1 7 Pregnancy 96 323 3.4 67 9 45 5.2 22 Skin 38 253 6.6 (75) 5 37 7.3 (7) Musc./Skel. 22 241 11.2 102 1 10 7.2 1 Injury/Poison 187 935 5.0 (376) 45 216 4.9 (96) Supplemental 40 491 12.4 349 1 10 7.2 5 Other 5 66 12.2 25 Total 770 5,696 7.4 828.6 140 993 7.1 69 Source: Analysis of the 1990-1992 National Hospital Discharge Survey by The Lewin Group.
Note: Components may not sum to totals because of rounding.
*LOS = Length of stay (average) in days.
- Table 4.9: Hospitalizations for Illnesses Partly Caused by Alcohol, 1992
-
Table 4.9: Hospitalizations for Illnesses Partly Caused by Alcohol, 1992 Illness Partly Caused by Alcohol ICD-9 Code Attributable Fraction (%) Attributable Discharges (thousands) Attributable Days (thousands) LOS (days) Respiratory tuberculosis 011-012 25% 4.0 61.5 15.4 Malignant neoplasm of lip, oral cavity, and pharynx 140-149 50 (men)
40 (women)12.2 105.5 8.7 Malignant neoplasm of esophagus 150 75% 13.9 175.8 12.6 Malignant neoplasm of stomach 151 20% 4.8 65.8 13.7 Malignant neoplasm of liver and interhepatic bile ducts 155 15% 1.6 19.1 12.0 Malignant neoplasm of larynx 161 50 (men)
40 (women)5.4 83.4 15.4 Diabetes mellitus 250 5% 22.1 160.0 7.2 Essential hypertension 401 8% 14.1 54.7 3.9 Cerebrovascular disease 430-438 7% 55.0 519.1 9.4 Pneumonia and influenza 480-487 5% 50.6 430.1 8.5 Diseases of esophagus, stomach, duod. 530-537 10% 58.2 335.5 5.8 Chronic hepatitis 571.4 50% 2.0 12.0 5.9 Cirrhosis of liver, alco. not mentioned 571.5 50% 9.5 100.7 10.6 Oth. chronic nonalcohol. liver damage 571.8 50% 0.7 4.5 6.7 Unspec. chronic liver disease, no mention
of alcohol571.9 50% 0.3 3.3 11.2 Portal hypertension 572.3 50% 1.3 12.5 9.3 Acute pancreatitis 577.0 42% 48.4 415.2 8.6 Chronic pancreatitis 577.1 60% 9.7 103.2 10.6 Fractures 800-829 10% 97.5 812.8 8.3 Dislocations 830-839 10% 5.2 16.6 3.2 Sprains and strains 840-848 10% 13.3 47.5 3.6 Intracranial 850-854 10% 16.6 94.8 5.7 Thorax, abdomen, pelvis 860-869 10% 8.4 70.7 8.5 Open wound-head, neck, trunk 870-879 10% 8.5 31.3 3.7 Open wound-upper limb 880-887 10% 5.7 25.9 4.5 Open wound-lower limb 890-897 10% 3.3 17.5 5.4 Injury to blood vessels 900-904 10% 1.0 7.5 7.6 Late effects 905-909 10% 0.7 7.4 11.3 Superficial 910-919 10% 0.9 2.8 3.0 Contusions 920-924 10% 7.1 32.8 4.6 Crushing 925-929 10% 0.6 3.7 6.5 Foreign bodies 930-939 10% 2.1 7.6 3.7 Burns 940-949 10% 5.0 56.8 11.3 Nerves and spinal 950-957 10% 1.0 8.4 8.5 Trauma, comp. 958-959 10% 2.6 13.7 5.3 Poisoning 960-968 10% 6.2 19.5 3.2 Poisoning 971-979 10% 3.3 10.4 3.1 Toxic effects 980-989 10% 3.4 11.0 3.2 Other external 990-995 10% 5.3 24.7 4.7 TOTAL, ALCOHOL-RELATED 511.5 3,985.3 7.8 Note: Components may not sum to totals because of rounding.
- Table 4.10: Non-Federal Hospital Days and Associated Costs Resulting From Alcohol and Drug Abuse, 1992
-
Table 4.10: Non-Federal Hospital Days and Associated Costs Resulting From Alcohol and Drug Abuse, 1992 Days of Care (thousands) Costs (millions) Alcohol Alcohol-specific illnesses 409 $414 Alcohol-related illnesses 3,985 $4,033 Additional days from co-occurring alcohol disorders1 871 $881 Subtotal, Alcohol 5,265 $5,328 Drug Abuse Drug abuse-specific illnesses 1 $1 Drug abuse-related illnesses * * Additional days from drug disorders1 511 $517 Subtotal, Drug Abuse 512 $518 TOTAL, Alcohol and Drug Abuse-Caused Illness and Days 5,777 $5,846 Treatment of Alcohol and Drug Abuse Disorders Alcohol disorder treatment 2,707 $9732 Drug disorder treatment 1,479 $6492 Subtotal, Alcohol and Drug Disorder Treatment 4,186 $1,622 TOTAL, Alcohol and Drug Abuse Hospital Cost and Days 9,963 $7,468 1Calculations of additional days resulting from alcohol abuse disorders exclude the days of care for alcohol-related illnesses in order to avoid double counting. For drug abuse, the proportion of discharges for which the additional days are calculated is assumed to be the same as for alcohol. Additional days from combined alcohol and drug abuse disorders are evenly split between alcohol and drug abuse. These values exclude effects on newborns, which are discussed more fully under special disease groups.
2The average cost per day for regular acute hospitalization, $1,012, is discussed below. Analysis of NDATUS presented in section 4.2 suggests that the cost per day for the treatment of alcohol and drug disorders on average ranges from $340 to $440, depending on sources of revenue. Because the days of care listed here are comparable to those found from analysis of NDATUS, the costs for hospital-based treatment presented in table 4.3 are also presented here.
*These costs are estimated in section 4.4, "Special Disease Groups."
Source: Analysis by The Lewin Group.
Note: Components may not sum to totals because of rounding.
-
Table 4.11: Costs of Outpatient Medical Care for Alcohol and Drug Abuse-Specific and Related Illnesses, 1992 Type of Medical Care Visits (thousands Costs (millions) General Psychiatry Other Total Alcohol abuse treatment 488 289 13 790 $131.1 Alcohol abuse specific 1,196 0 189 1,385 $229.9 Alcohol abuse related 5,815 11 3,325 9,151 $1,519.1 Total, Alcohol Abuse 7,499 300 3,527 11,326 $1,880.1 Drug abuse treatment 192 112 0 304 50.5 Drug abuse specific 0 0 0 0 0 Drug abuse related * * * * * Total, Drug Abuse 192 112 0 304 $50.5 Total, Alcohol and Drug Abuse 7,691 412 3,527 11,630 $1,930.6 TOTAL, Excluding Alcohol and Drug Abuse Treatment 7,011 11 3,514 10,536 $1,749.0 Source: Analysis by The Lewin Group.
Note: Components may not sum to totals because of rounding. The bottom row of this table excludes treatment for drug and alcohol abuse disorders, which are reported in section 4.2.
*These costs are estimated in section 4.4, "Special Disease Groups."